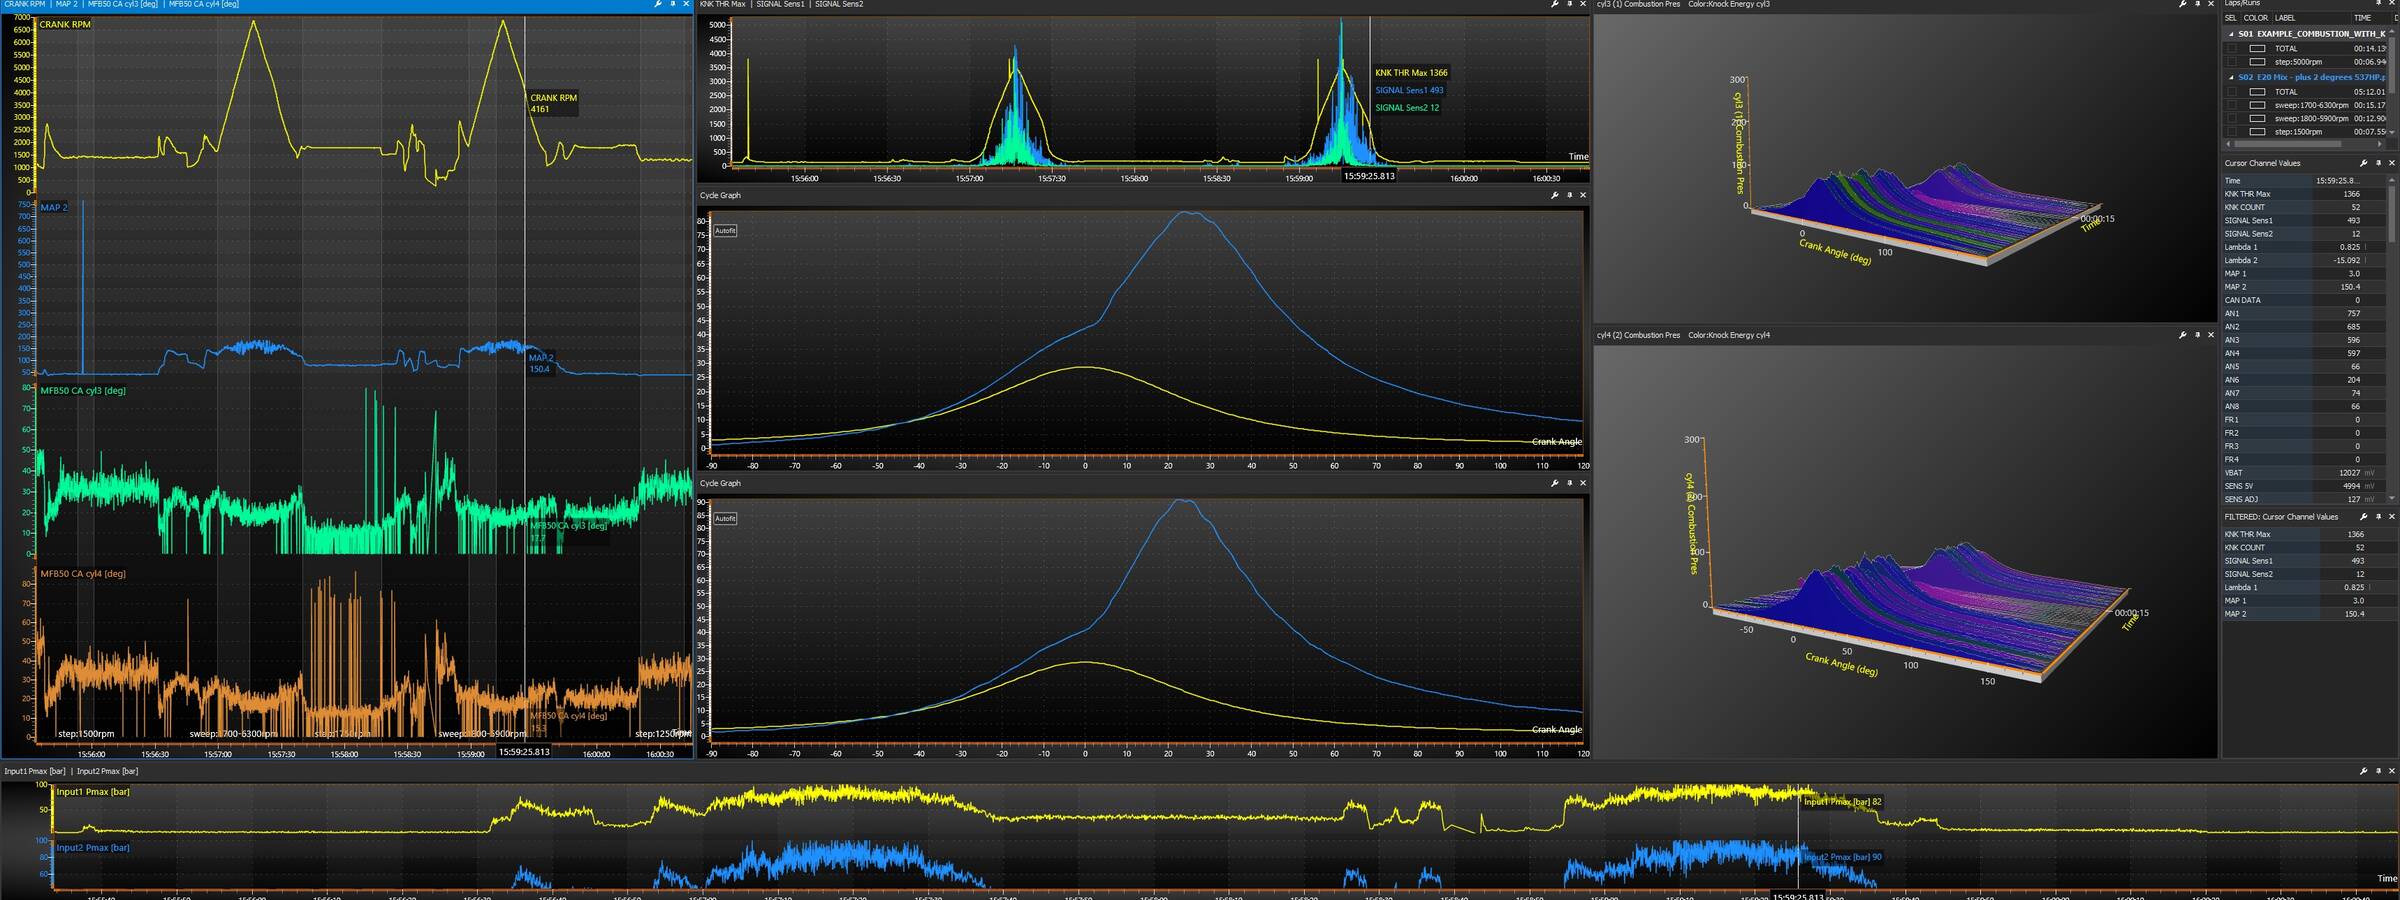
In-cylinder pressure measurement is different. It puts a sensor into the combustion chamber directly and records the pressure right through the cycle. So instead of inferring what combustion did from its side effects, we can watch it happen live, and log it for review afterwards. The examples throughout this series come from in-cylinder pressure measurements I've taken across a number of engine programs, using the PCA-2000 combustion analysis system from PLEX, and hopefully these examples will give you a little more insight into the world of in-cylinder pressure measurement.
This is the first part of a two-part series. In part one, we'll look at what the signal is, what it can tell you about the combustion event, and how it connects to the combustion concepts we teach across our programs. In the second part we'll look at cycle to cycle variation, how it impacts the knock limit, and some of the options we have to limit this variability.
Everything we normally measure is downstream
So, think about the tools we typically use when we're tuning, and where they sit relative to combustion.
The dyno measures torque at the flywheel, the wheels, or the hubs. That torque is the end result from the pressure that combustion produced, acting on the piston, averaged over every cylinder and every cycle in the pull. It's real and it's useful, but by the time it reaches the dyno we can't see what's happening in any individual cylinder, or on any individual cycle. If one cylinder is doing something different from the others, the dyno can't see it, it just shows you the total engine output. A cylinder balance test gives you some insight into what a particular cylinder is doing, but you're still measuring downstream of the combustion event no matter what trickery you get up to with the dyno alone.
A lambda sensor tells us the air/fuel ratio in the exhaust stream, after combustion is over and the gases have left the cylinder. We can fit individual lambda sensors to each exhaust runner to see what's happening in each cylinder, and the same goes for exhaust gas temperature sensors. This doesn't fully solve the problem though. These sensors give us a snapshot at whatever rate they're sampled and logged, and they're a lagging indicator, so we're reading gas that left the cylinder well after the combustion event has finished. They also come with their own challenges in terms of our ability to trust the numbers these sensors provide too.
I'd consider a knock sensor essential for almost all tuning work, but at the end of the day it's just an accelerometer bolted to the engine, sensing the structural vibration that a knocking cylinder sends through the metal it's connected to. So, it's detecting a mechanical consequence of abnormal combustion rather than the abnormal combustion itself. Reading the plugs can tell us something about conditions in the chamber too, but only as an accumulated impression over many cycles, and only after the engine has stopped and they've been removed for inspection.
None of this is a criticism of these tools and methods, they're the backbone of calibration and they always will be. The point is simply that they all describe combustion indirectly, and they all either average across cylinders, average across cycles, or arrive after the fact. Some do all three.
A pressure sensor in the chamber removes these layers and brings our measurement into the cylinder itself. It measures the thing that generates torque, in a specific cylinder, on a cycle-by-cycle basis, at the moment it happens. That's why it's worth understanding, even if you never run one of these sensors yourself. Knowing what the in-cylinder signal looks like changes how you interpret all the indirect data we normally rely on.
Every measurement we normally rely on describes combustion after the fact, from outside the cylinder. A pressure trace is the one signal taken from the event itself, as it happens.
What a pressure trace actually is
A combustion pressure trace is a plot of cylinder pressure against crank angle. The horizontal axis is degrees of crankshaft rotation, usually running from somewhere back in the compression stroke, through top dead centre, and out into the expansion stroke, and this is usually configurable depending on the data acquisition system you're using. The vertical axis is the pressure inside the cylinder. One trace is one combustion cycle.
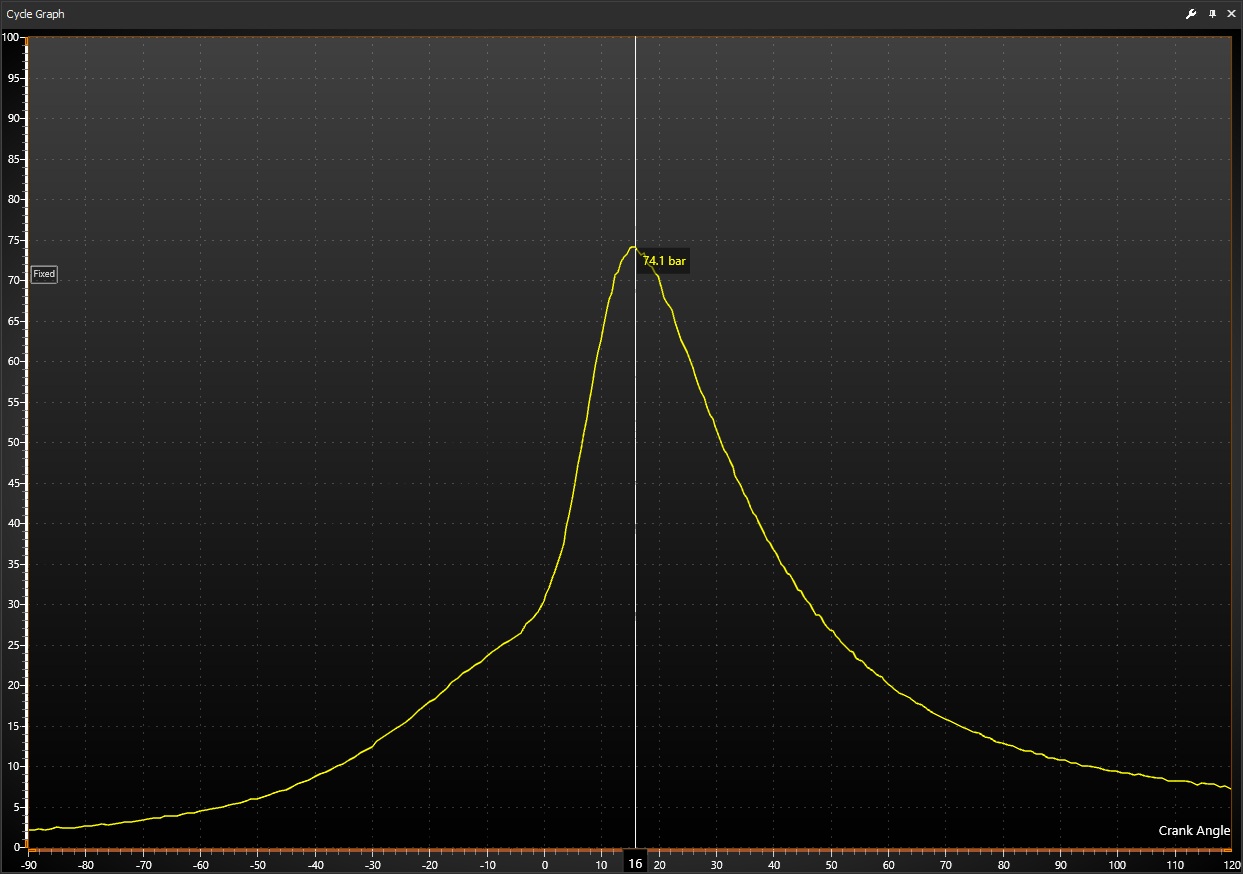
The reason we plot against crank angle rather than time is worth understanding, because it's the same reason logging rates matter when you're capturing any fast changing engine event. Combustion phasing, which is simply where in the engine cycle combustion is occurring, is tied to piston position. What matters is where the pressure develops relative to where the piston is, not how many milliseconds have passed. Plotting pressure against crank angle puts piston position on the axis directly, so you can read straight off the trace where in the stroke the pressure peaked, where the burn started, and where it finished, at any engine RPM.
So, the trace is a picture of the pressure event, relative to crank (and therefore piston) position. With the trace laid out in this way, we can glean a lot of useful information by reading the shape of the curve and where its features line up with crank position. Once we have the data we can look at it in other ways as well, which tells us more about the mechanical work each cylinder is doing, and associated pumping losses. The basic combustion trace is what we'll focus on in this article.
Peak pressure and where it happens
The first thing most people look at is the peak, and in particular how high it is and where it sits relative to crank position.
In the article on ignition timing and MBT we looked at how torque depends on both the peak cylinder pressure and where that peak lands in the cycle. We also covered the fact that we want peak pressure occurring somewhere around 14 to 18 degrees after top dead centre, so the connecting rod has good leverage on the crank. That range is a practical guide rather than a fixed number, since the exact optimum shifts a little with engine geometry, and you'll see slightly different windows quoted depending on the test conditions.
The interesting thing is that when you're tuning by conventional means, you never actually see that position. You infer it. You advance timing, watch the dyno, and work out that peak pressure must have moved closer to where you want it, because the engine is making more torque. If torque drops off, you've moved the peak somewhere less useful. What you can't see is where it actually is for any given ignition advance.
A pressure trace shows you the peak and its location directly. You're no longer guessing where peak pressure sits from the torque it produces. You're reading it off the axis.
A spark sweep, where you advance the timing and plot torque output on the dyno to identify MBT can be a useful way to determine the crank position window for the engine you're working on, by correlating peak torque with the pressure data. The useful thing here is that the crank position for MBT is relatively insensitive to RPM and load. So, unlike a dyno where you'd have to do a spark sweep for every Load and RPM point because of changing conditions, once you have identified your optimum MBT window with a single spark sweep, that window gives you a target in the pressure trace you can work to, right across the map. This obviously needs to be done in an operating area where the engine isn't knock limited and MBT can be reached safely. The window isn't completely fixed, and it does shift a little, mostly with burn duration, so treat it as a window rather than a single number. It's the very reason we vary our ignition timing based on load and RPM, so that the same crank position window can be targeted.
Peak pressure location has always been the target we tune towards. Without a pressure trace, you were aiming at it through the torque it produced. With a pressure trace, you can see it directly.
The height of the peak, usually called Pmax, tells you how much the combustion pressure is loading the engine mechanically. A high Pmax means high mechanical forces and stress on the piston, rings, rod, and bearings, and it climbs with advanced timing, higher compression, and boost. Different engines tolerate very different peak pressures depending on how they're built, so there's no single number that's right, but every build has a limit somewhere. What the trace gives you is the actual figure for the conditions you're running, rather than a guess. That matters most on a built engine where you're trying to make power without exceeding what the hardware can physically take.
There's a limit to what that single peak value can tell you though. Peak pressure is set by two things at once, how quickly the charge burns and where in the cycle it burns. A quicker burn releases its heat over less crank rotation, which drives the peak higher because the volume in the cylinder is closer to being constant. A burn that happens later moves the piston further from TDC and so there is volume in the cylinder that the pressure from combustion expands into, which lowers the peak. Those two can offset each other, so a slow burn, ignited early, can land on much the same peak as a quick burn ignited later in the engine cycle. From the height of the peak on its own, you can't tell which one you've got.
So that's why we don't just look at the peak, we need to read the rest of the curve.
Reading the shape of the curve
That first trace we looked at was a single clean cycle, and it's worth going back to it now, because before we start pulling numbers out of the trace there's a good deal the shape of the curve tells us on its own.
Up until combustion starts doing something, the pressure in the cylinder is just the piston compressing the trapped charge. That part of the curve would look the same if the engine were turning over with no combustion happening at all, and that makes a very useful reference to have. We call that the motored trace, and what combustion does is add pressure on top of it.
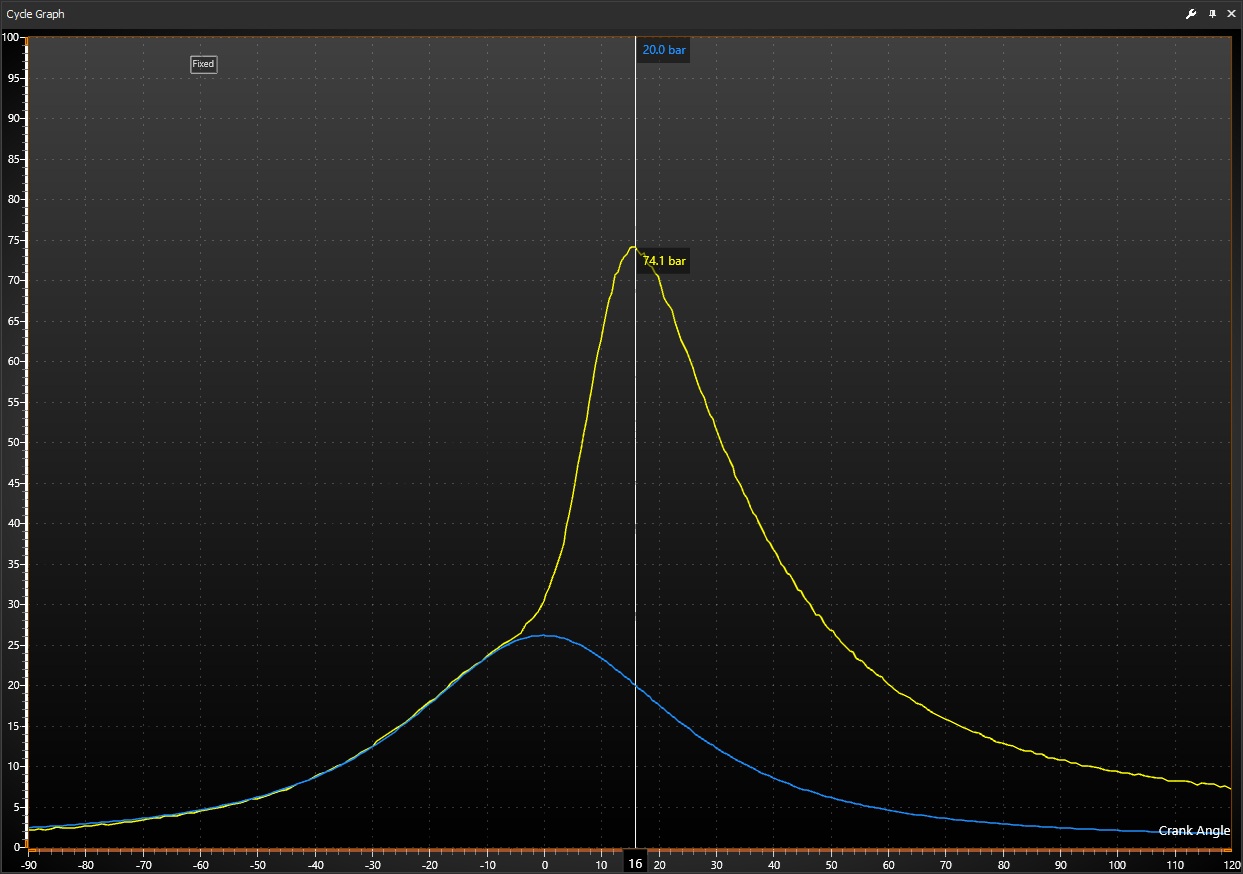
Where the combustion trace departs from the motored one is the first thing to look at. This is the point where the heat released during combustion has generated sufficient pressure to move the measured pressure above motored pressure. It's not where the spark occurred. There's a delay between the spark firing and the flame kernel growing large enough to raise in-cylinder pressure, so the departure always sits some number of crank degrees after the spark event. What it marks is where heat release actually got going, and that's what combustion phasing is really about.
Then look at how the trace behaves through that departure.
On a well phased engine, combustion starts adding pressure while the piston is still on the compression rise, so the trace comes smoothly off the back of the compression curve and carries on up to a single clean peak, a little after top dead centre. One continuous rise, with no hesitation in it.
Pull timing out and that changes. Combustion is now arriving after compression pressure has already peaked at top dead centre and started falling away. The trace rises with compression, starts to roll over near top dead centre, then picks up again as combustion catches up, leaving a shoulder or a plateau between the two. With genuinely under advanced timing it becomes a visible dip, with pressure falling off the compression peak before combustion pushes it back up again. The peak that follows is later and lower.
Go the other way and the pattern reverses. Combustion starting too early departs from the compression curve well before top dead centre, and pressure climbs steeply while the piston is still coming up. The peak lands very close to top dead centre, and it's high. That's pressure working against the piston rather than with it. You only see this type of trace if you have over-advanced the timing beyond MBT and haven't run into knock.
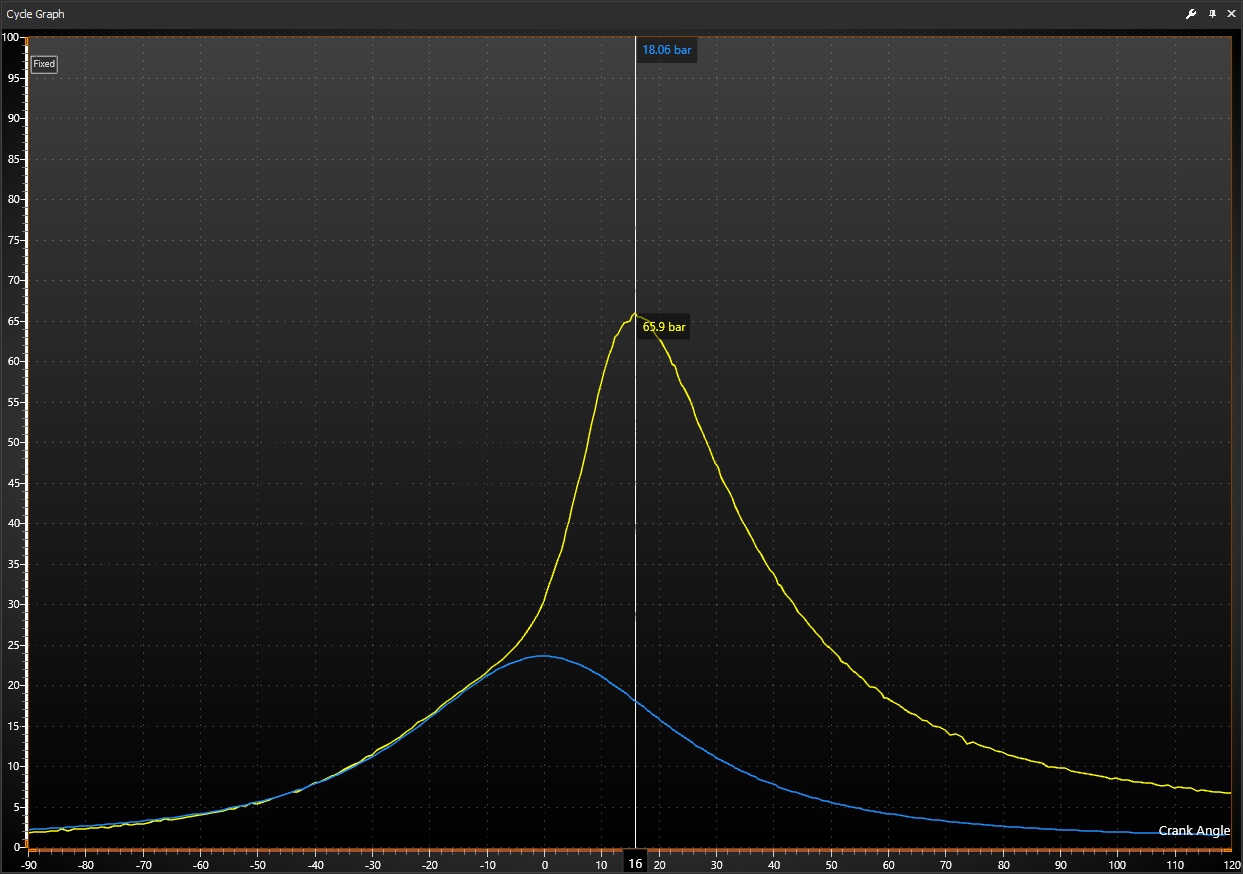

So the shape of that transition is a direct read on phasing. A smooth continuation off the compression curve says burn initiation is close to where we want it. A shoulder, a plateau, or a dip says combustion is arriving late, and the size of it tells us how late. A steep early departure says the opposite. None of that needs any calculation at all, it's sitting there in the raw trace.
What knock looks like on the trace
There's one shape on the trace that's unmistakable once you've seen it, and it's worth covering on its own.
We spend a lot of time on knock because it's the most common abnormal combustion event you'll come across, and because it's usually the thing that stops us reaching MBT. A knock sensor detects knock as structural vibration, with the accelerometer on the block picking up the ringing that travels through the metal after the end-gas autoignites. That works well enough, and it's what almost every calibration relies on, but it's still an indirect read of what is fundamentally a pressure event.
In the pressure trace, knock shows up very distinctly. When the end-gas autoignites, it releases its energy almost instantly, and that creates an immediate spike in pressure, followed by the pressure waves that bounce back and forth across the combustion chamber. The waves appear in the trace as a high frequency oscillation right after the peak, with the pressure rise compressed into a much shorter span of crank angle than normal combustion. The smooth curve of normal combustion turns jagged. You can see the pressure ringing directly, at its source, rather than the structural echo of it that eventually reaches the block, assuming that the knock sensor can even distinguish the difference between the knock event and other mechanical vibrations that are naturally occurring.
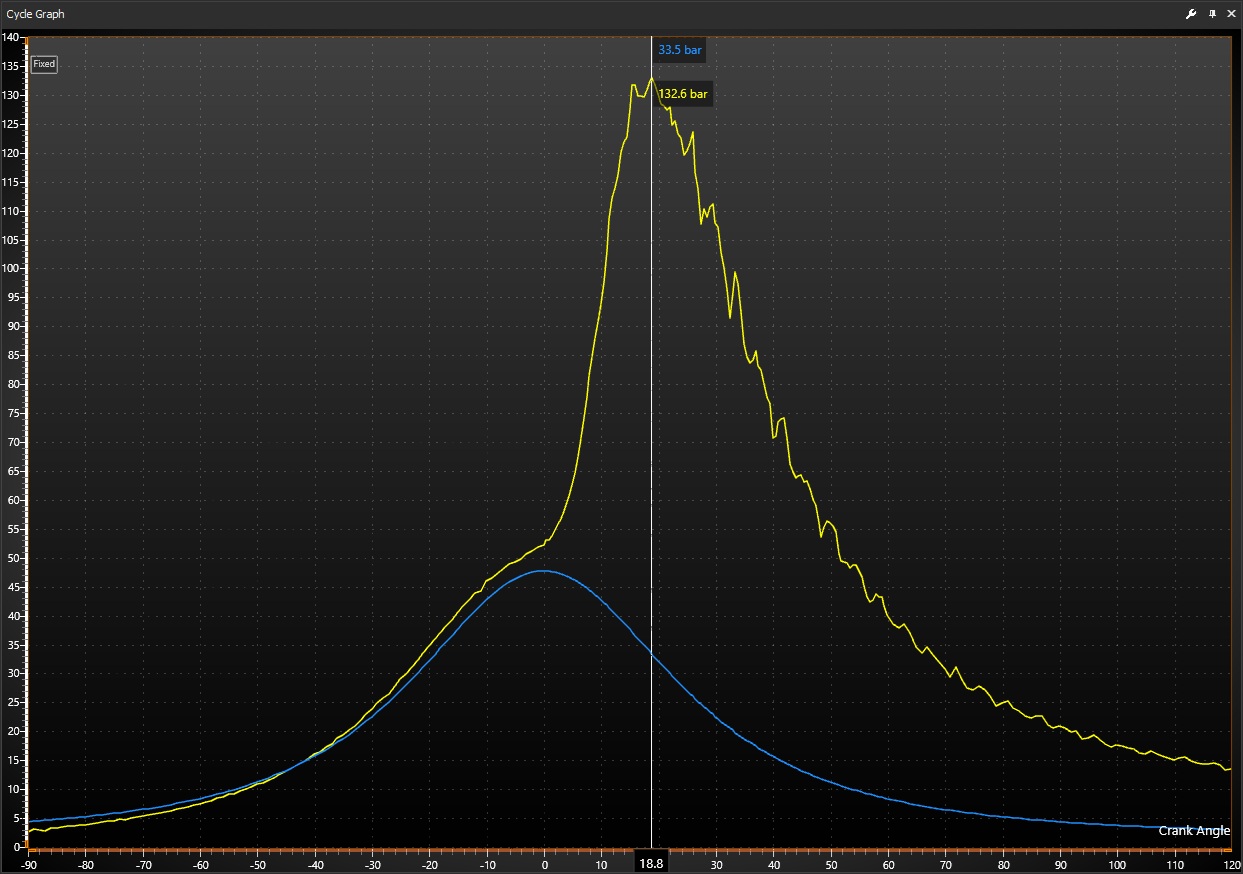
There's a connection here to something we've covered before. In the article on bore diameter and knock frequency we explained that the frequency of the knock oscillation is heavily influenced by the bore diameter, because the chamber acts as a resonant cavity with pressure waves reverberating inside it. The frequency a pressure trace shows in the oscillation after a knocking cycle is that same resonance, just visualised in pressure terms. The knock sensor is tuned to listen for it in the block. The pressure trace shows it in the chamber.
A knock sensor detects the structural echo of knock reaching the block. The pressure trace shows the pressure waves in the chamber where they start.
We'll leave knock there, because interpreting knock severity and deciding what to do about it is beyond the scope of this series. The point for now is simply that the pressure signal contains knock in its most direct form and that, regardless of other mechanical influence, it's easily observed.
Reading a run of cycles
Everything so far has looked at one trace. In practice you'd never make a calibration decision from a single cycle, and we'll look at why that is next.
No two combustion cycles are identical. Hold the engine at a steady operating point, capture a run of consecutive cycles, and you'll find peak pressure moving around from one cycle to the next, its location shifting a few degrees either way, and the whole burn drifting a little earlier and later. That's normal. It happens on a perfectly healthy engine, and it's a property of combustion rather than a fault to go chasing, and it's why we look at combustion phasing across a crank position window as opposed to a single, specific number.
Looking at several cycles will give you a much clearer picture which you can then use to make your decisions with. If a series of combustion traces is centred well before the window, we're over advanced and there's nothing more to be had by going further. If it's centred after it, we're leaving torque on the table and there's room to advance, assuming we haven't observed any knock. Unlike the dyno, which only ever tells us whether the last change helped or hurt, this tells us how far from the target we are and in which direction, which is a much better position to be making decisions from.
The width of the series matters as well, which is effectively how far apart the peaks are across several cycles, in crank degrees. A series of combustion events, centred nicely in the window but with a large variation either side, means a good number of individual cycles are still peaking early, effectively running more advance than we're asking for. Those are the cycles that reach the knock threshold first, and they're what really decides how much timing the engine will take before the onset of knock. We'll pick up on this idea in more detail in Part 2.
This changes how we need to go about assessment and validation of any changes we make. Say you pull two degrees of timing out and want to see what it did. If you only take one cycle from before the change and one from after, you've got a problem, because two cycles from the 'before' conditions would have looked different anyway. You can't differentiate your change from the engine's own natural variation.
The fix is to compare averages instead. Take a run of consecutive cycles at each condition, average each run, and the natural scatter largely cancels, revealing the real difference from the change you've made. Any combustion analysis system will do this for you. You just need to make sure you're averaging over the appropriate number of cycles, being mindful of any data that might influence the average (such as knock events, misfires, etc).
The spread itself is worth measuring in its own right. How tightly grouped the cycles are is a direct read on how stable combustion is, and there are two parts to it, how much the location of the peak moves and how much the height of the peak moves. Understanding variability is extremely useful, and it's where we'll pick things up in part two.
Comparing one cylinder against another
There's another thing a trace, or series of traces, gives us that the dyno simply can't, and it comes from running that same averaged view on every cylinder separately.
The dyno only ever gives us one torque figure for the whole engine. It can't tell us that cylinder three is pulling its weight while cylinder one is lagging behind, because all it sees is the total. Lambda has the same problem if we're measuring in a collector, and even per-bank lambda still averages across the cylinders feeding that bank. Put a pressure sensor in each cylinder and that kind of averaging stops. We get peak pressure, its location, and can derive CA50 (the crank angle at which 50% of the mixture has burned) for every cylinder individually.
We can also compare the actual work each cylinder is producing, measured as indicated mean effective pressure, or IMEP. IMEP comes from plotting pressure against cylinder volume rather than against crank angle. That's a whole topic in itself which we'll cover in a future article. The important thing to know is that IMEP is the measure of how much work a cylinder is really doing, and using in-cylinder pressure measurement allows us to do detailed analysis at this level.
The per-cylinder view is one of the strongest arguments for combustion pressure measurement on a serious engine. Balance problems that are invisible to every 'averaged' measurement we normally use become obvious the moment we can see what each cylinder is contributing individually.
Where this leaves us
So, we've seen that a pressure trace lets us read peak pressure and its position directly, read combustion phasing off the shape of the curve, see knock at its source, and compare one cylinder against another without dyno or sensor averaging diluting the picture.
We've also looked at cycle to cycle variation and how it can impact analysis and comparisons, and that working from a run of cycles rather than a single trace is how we can get meaningful insights from the data. That variation isn't only an obstacle though. Measured properly it turns out to be one of the more useful things the trace has to tell us, and it's what contributes to how much timing an engine will take, which is the subject of the second part of this series.
Key points
So, let's bring this all together.
- Almost everything we normally measure when tuning sits downstream of combustion, whether that's dyno torque, lambda, EGT, knock sensor activity, or a plug read, and it either averages across cylinders, averages across cycles, or arrives after the event. A pressure trace is taken from the combustion event itself.
- A combustion pressure trace plots cylinder pressure against crank angle for one cylinder over one cycle. Plotting against crank angle rather than time puts piston position on the axis, which is what combustion is tied to.
- Peak pressure and its location can be read directly off the trace rather than inferred from torque. Pmax tells you how hard combustion is loading the engine mechanically, but the height of the peak on its own is ambiguous, because a slow early burn and a quick late one can give you the same figure.
- The shape of the trace against the motored curve is a direct read on phasing with no analysis needed. Well phased combustion comes smoothly off the compression rise to a single peak. Under advanced timing leaves a shoulder, a plateau, or a visible dip before combustion catches up. Over advanced timing departs early and peaks at or before TDC.
- Knock appears as a high frequency oscillation after the peak, at a frequency influenced by the bore diameter. Knocking cycles also tend to peak early and high, with oscillations following the peak.
- No two cycles are the same, so phasing is read as a distribution rather than a single number. What matters is where the band of peak locations centres relative to the target window, and how wide that band is. Comparisons are made on averages across a run of cycles, and the spread is measured on both the location of the peak and its height.
- A sensor in each cylinder gives peak pressure, peak location, CA50, and IMEP for every cylinder separately, which is how you find balance problems that a dyno and a collector lambda reading can't.
As always, the more we understand about what's actually happening inside the cylinder, the better we can read and interpret everything we measure outside of it.
If there's a specific topic or area you'd like us to cover in a future article or video, we'd love to hear from you. Send your requests through to support@efimastery.com and we'll keep you posted.
The pressure data behind this series was captured with the PLEX PCA-2000 combustion analysis system. Thanks to PLEX for supplying data and reviewing both articles.
Related Resources
Related Articles
Combustion phasing, MBT, and knock are covered in depth in Stage 3 of the Calibration Competence and EFI Master Programs. Take the free assessment to find out which one fits your goals.
Find Your ProgramGet notified of new articles
One article per week on EFI fundamentals, calibration principles, and diagnostic thinking. No spam.
You're subscribed. We'll let you know when new articles are published.