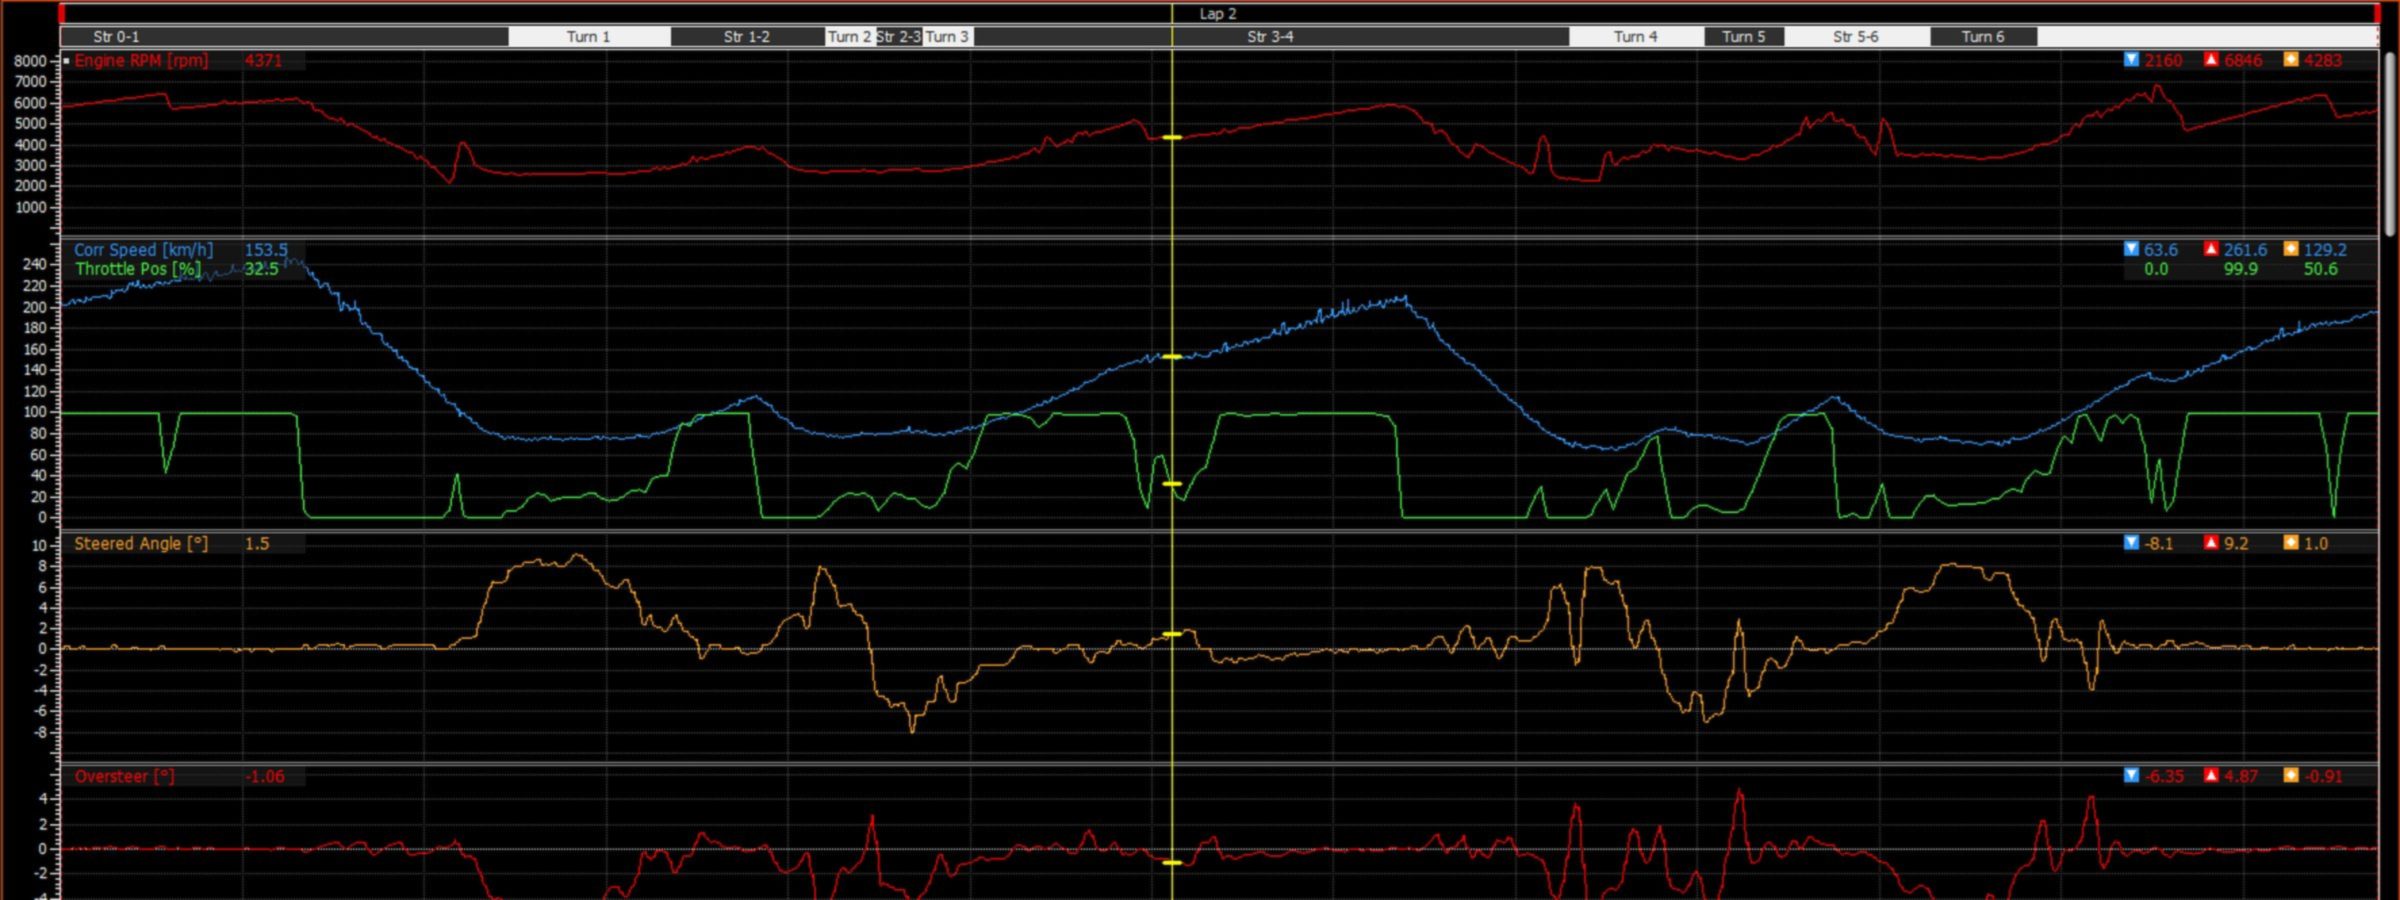
The data logging rate is often the culprit in these scenarios. It's a setting that's either left to the defaults or incorrectly specified, and it controls how much of the run actually makes it into your logged data.
In this article we'll look at what a logging rate is, what it gives you, what it leaves out, and how to tell whether you captured what you were after.
What a logging rate actually is
The first thing to understand is that your logger doesn't watch the engine constantly. It takes a reading, waits a moment, then takes another one, and so on. How many readings it takes every second is the logging rate or sample rate, measured in Hertz (Hz), which just means times per second. So a channel set to 20 Hz gets read 20 times a second, or once every 50 milliseconds.
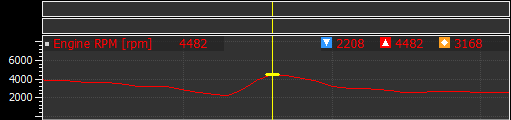
The part that often trips people up is what happens between those readings. When you open the log you see a smooth line, but most of that line isn't data at all. Your logger recorded a series of dots and the software joined them up for you.
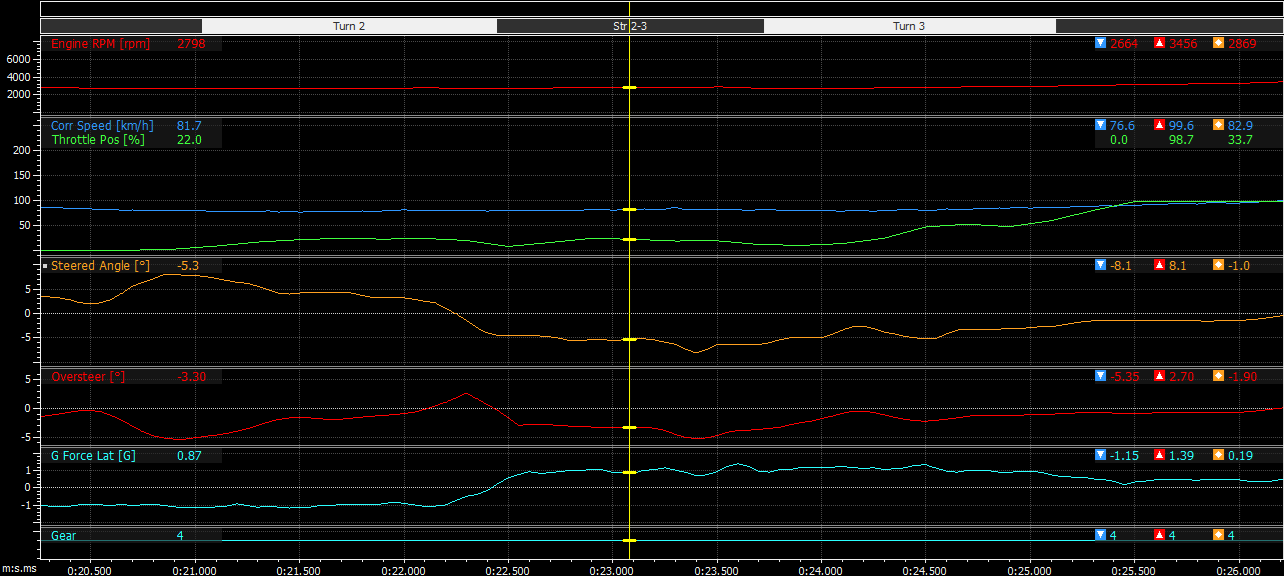
Think of it like a film. It looks like continuous movement, but it's really just a series of stills played back quickly, and anything that happened between two frames was never recorded.
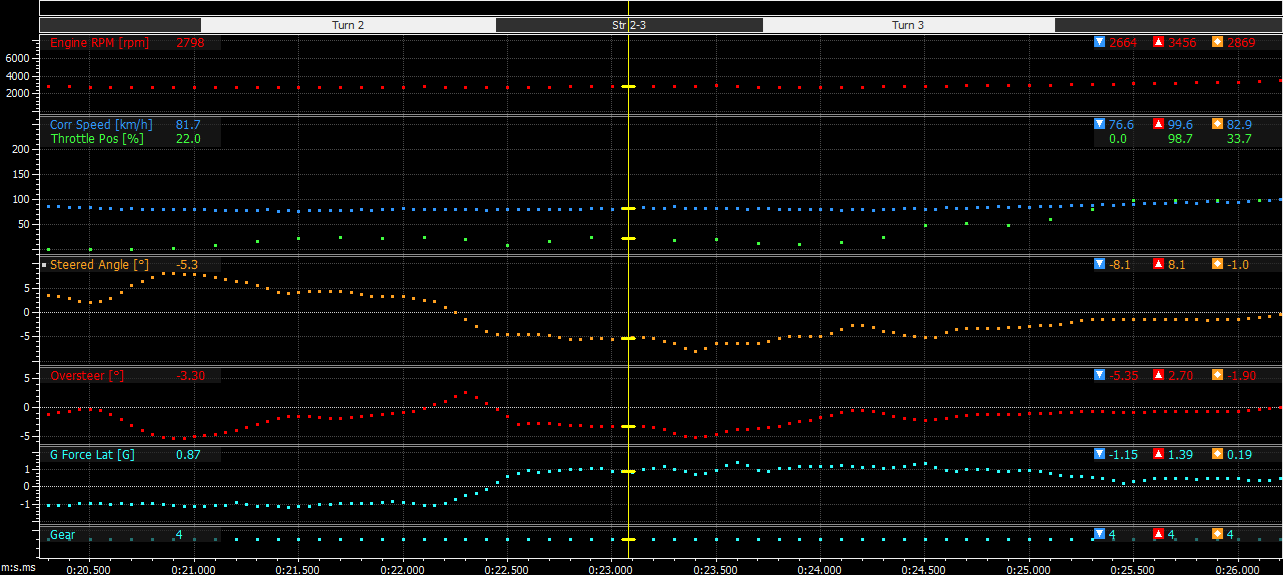
The line between two samples is drawn by the software. Only the dots are real.
So the dots are all you get. In other words, your log isn't a record of the run, it's a record of the moments you happened to measure.
Not everything on the engine moves at the same speed
So what logging rate should you use? That depends entirely on what you're measuring, because different systems on your engine change at different rates.
Changes in coolant temperature are normally measured in seconds, because there's a lot of metal and water to heat up and cool down. Throttle position can go from closed to wide open in a fraction of a second, and manifold pressure fluctuations can happen every engine cycle. Knock sensors pick up vibrations that are happening thousands of times a second at a frequency set by the size of your bore, which we covered in why bore diameter determines knock frequency.
Using a logging rate that's sufficient for one channel is often useless for another. Log coolant temperature at 100 Hz and you'll get a hundred nearly identical numbers every second. Log a fast throttle movement at 5 Hz and you might get two points on the way up, which tells you it moved but not how quickly or how smoothly.
Why twice as fast isn't enough
You might have come across the rule that you need to sample twice as fast as whatever you're measuring. It's a real rule, but it will give you data that is only really good for one purpose, which is for rebuilding a signal mathematically.
What we're actually doing is opening a log file with a whole bunch of squiggly lines and reading a number off it, and that takes a much higher sampling rate if you want to be able to make meaningful conclusions from the data.
In practice you want to be closer to ten times faster than the quickest thing you care about. Siemens give that figure for getting the peak on your graph anywhere near the real one, and Dewesoft use the same number for seeing the true shape of a signal, and these guys have been in the data acquisition game for a while.
Here's why. Say you've got a spike that lasts a tenth of a second. At 20 Hz you get two readings across it, and where those two land is pure luck. They can easily fall either side of the peak and miss it completely. At 100 Hz you get ten readings, and the shape starts to look like the real thing.
If the event you care about is only two or three samples wide, you noticed it. You didn't measure it.
Faster isn't free
At this point you're probably thinking, why not turn everything up to maximum and forget about it? Fair question. There are two things we need to think about when considering logging rates for data collection.
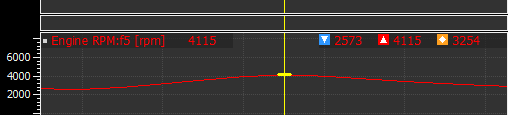
The first is capacity. Every channel you log adds to the total amount of data you use per second of logging time, and so does the logging rate. So if you log a large number of channels and a high sample rate, then you are asking for a lot of data every second. Your logger typically has a limit to how much memory and how much data processing it can do. Turn everything up and the log can run out partway through the session, or the system can struggle to log all of the data you want.
The second is that a faster rate doesn't always buy you anything. If you log a channel quicker than the number behind it actually updates, you don't get more information, you just get the same number written down over and over. The trace comes back looking smooth and detailed, but none of that detail is real.
So treat it like a budget. Spend the fast rates where things move quickly and matter, and go easy on everything that barely changes. That's exactly why your logger lets you set rates per channel.
As always, there's a trade-off. Some systems only let you set one rate for everything, and then you're picking it for the fastest channel you genuinely care about and wearing the cost on the rest, but most systems these days give you at least some flexibility in choosing your logging rates.
Sometimes, regardless of the logging options you have, you're just not that lucky. I've been involved in motorsport events that last six hours or more, and at that point, you're getting a limited amount of data that, at best, can show you general trends over the longer stints in a race, and that's about it. There's just not enough capacity to give you any more than that. It is what it is, and as long as you understand the limitations of the data you're looking at, that's the important thing.
Making sure you got what you came for
So how do you know you actually got what you came for? There's a few things you can do.
The first is to decide what the log is for before you set it up. If you're chasing a stumble on tip-in, throttle and lambda need to be quick and coolant temperature doesn't matter much. If you're checking whether the engine gets hot over a long run, it's the other way round. The question you're asking is what sets the rates.
The second is to go and look at the data you came for once you've got the log. Does the event have enough points across it to show its shape? If it's two dots with a straight line between them, you've spotted it, but you haven't measured it, and you might need to repeat the test with increased logging rates.
The third is to do the same run twice. If the peak you read off is noticeably different each time, you're not sampling fast enough to catch it, and you're just getting lucky or unlucky with where the readings fall.
Decide what question the log needs to answer before you set the rates. That one decision does most of the work.
Key points
So, let's bring this all together.
- A log is a series of readings with gaps in between. The line joining them is drawn by the software, not measured.
- Different things change at different rates, so there's no single rate that suits all measurements.
- What sets the rate you need is how fast the thing itself moves, within the limitations of your logging capacity.
- To trust a peak you've read off a graph, you want around ten readings across the event, not two.
- Logged too slowly, data can show patterns that never happen, and they look completely real.
- You can't fix anomalies in the data afterwards. Filtering and smoothing only tidy up the wrong data.
- Turning logging rates up costs memory, can cut your session short, and adds nothing to channels that update slowly.
- Work out what the log needs to answer first. That tells you where to focus your logging rates and what can be lowered or removed entirely.
As always, the more we understand about how our data gets recorded, the more we can trust what it's telling us.
Data logging and log analysis are covered in depth in Stage 4 of the Calibration Competence and EFI Master Programs, where you build a repeatable way of working that turns raw data into meaningful calibration decisions. Take the free assessment to find out which Program fits your goals.
Find Your ProgramGet notified of new articles
One article per week on EFI fundamentals, calibration principles, and diagnostic thinking. No spam.
You're subscribed. We'll let you know when new articles are published.