Why no two cycles are the same
We've already seen that a run of consecutive cycles won't just lie on top of each other. So why do they differ at all?
It comes down to the earliest part of combustion, the formation of the flame kernel at the spark plug and its transition into a travelling flame front, which is very sensitive to the local conditions right at the plug at the moment of ignition. Those conditions vary a little every cycle.
The result is that the kernel grows a little quicker on some cycles than on others, and a kernel that gets away quickly goes on to burn the charge quickly. The whole burn ends up faster or slower from one cycle to the next, and that single difference moves the peak in two directions at once. A quicker burn releases its heat over less crank rotation, so the peak comes out higher, and it gets there sooner, so the peak lands earlier in the cycle. A slower burn does the opposite on both counts. What we end up with is scatter along the crank angle axis and scatter in the height of the peak, and they're two readings of the same underlying variation rather than two separate problems.
You can see the link if you plot peak height against peak position for a run of cycles at fixed ignition timing. The points fall along a diagonal, high and early at one end, low and late at the other, because burn rate is influencing the data on both axes.
Where the peak occurs is what we compare against the target window, and it's what shifts when a cycle burns faster or slower than average. We measure it as the standard deviation of the peak pressure location across the run, in crank degrees.
How high the peak gets is measured as a coefficient of variation (CoV), which is the standard deviation across a run of cycles divided by the mean, expressed as a percentage. Applied to peak pressure it gives us CoV of Pmax. A low number means the cycles are tightly grouped and combustion is stable around a common pressure level. A high CoV means they're more spread out and combustion across cycles is less stable and consistent.
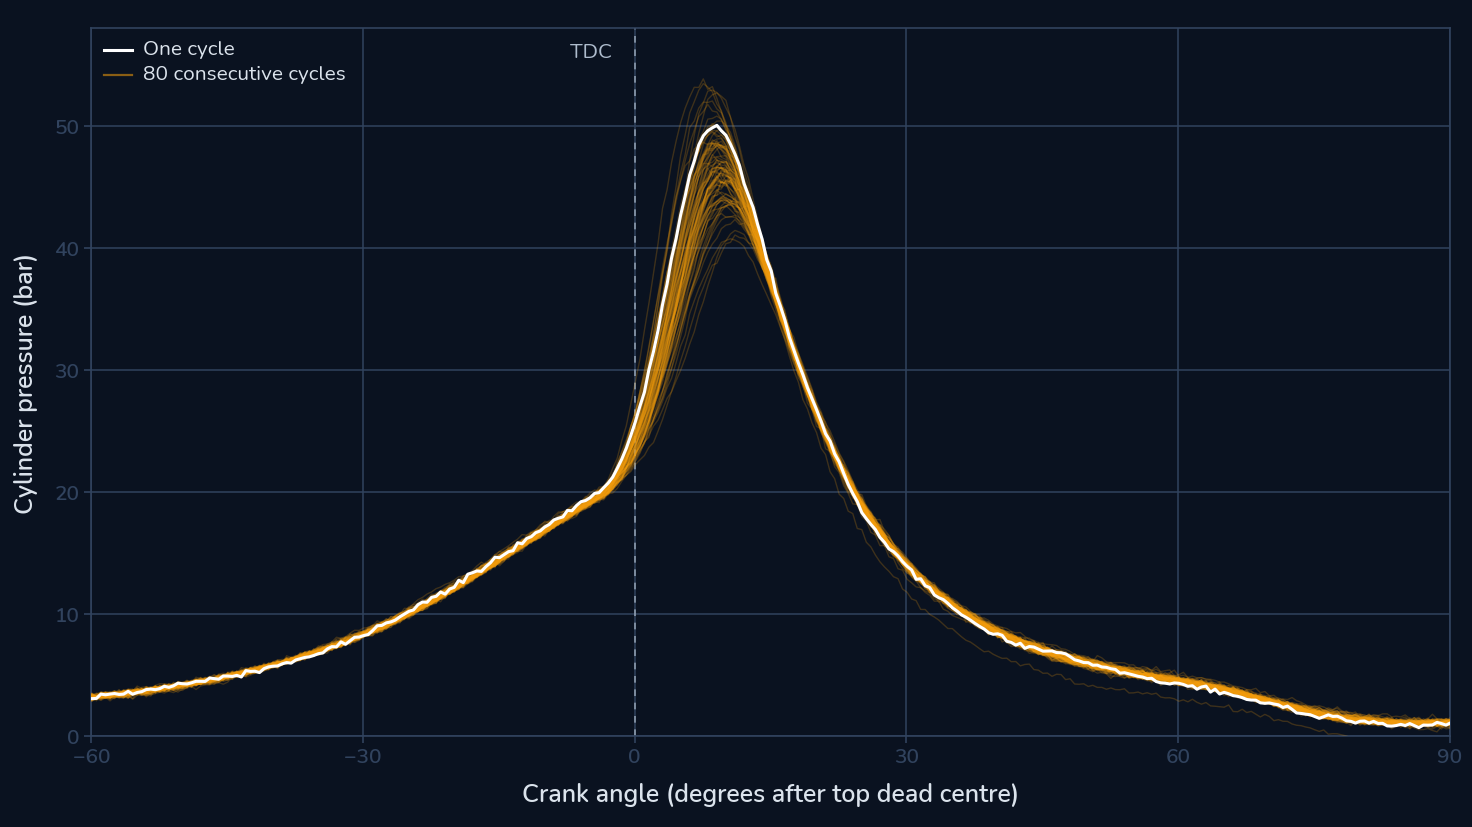
Average a run of cycles and the scatter disappears along with the detail. The thing that sets your knock limit is only ever visible cycle by cycle.
The spread is what sets your knock limit
Now, here's the part that connects straight back to the dyno and to knock limited spark advance, or KLSA. When we set ignition timing, we set one timing value, and combustion responds to it one cycle at a time with all of that cycle to cycle scatter. The timing we pick is right for the average cycle. But the fast cycles in the distribution, the ones that burn quicker than average, are effectively running more advance than we set, because they are centred earlier in the cycle. Those fastest burning cycles are the ones most likely to knock at full load, and they're what sets the knock limit for the whole engine.
Part 1 showed a knocking cycle peaking earlier and higher than the ones around it. Now we can say why. It burned faster, so the end gas reached a higher pressure and temperature sooner, and that's the cycle that hits its autoignition limit first and knocks most severely when it does. The ignition timing is the same for every cycle here, knocking or not. The difference is entirely in how the charge burned and the length of the exposure of the end-gas to temperature and pressure.
So that reframes what KLSA actually is. You're not knock limited by the average cycle. You're knock limited by the worst cycles in the spread. The average timing you can run is held back by the fast tail of the distribution, because those are the cycles that reach the knock threshold first.
Which means anything that tightens the distribution has the potential to move the knock limit. Reduce the cycle to cycle variation and the fast tail moves back towards the average, so the whole distribution can shift to more advance before the worst cycle reaches the knock threshold. Lower variation buys us more usable timing, or additional safety margin. Spend it how you will.
Knock isn't the only application of this concept. Every build has a peak pressure the engine can take, which we covered back in the first part, and on a boosted or high output engine that ceiling can arrive before knock does. That's especially true with high octane fuels, where the knock limit has moved out far enough that hardware strength limits are what you run into first. Pmax varies cycle to cycle, so the ceiling has to be judged against the highest cycles rather than the average. A wide pressure spread forces us to run a lower average just to keep within these pressure limits. Tighten the spread and the average can come up, which is headroom we can spend on boost, timing, or other factors that allow the average Pmax to be increased.
What tightens the spread
Mixture strength is one lever, but it's worth being precise about how it works, because it doesn't act on stability directly. It acts on flame speed, and flame speed acts on stability.
Laminar flame speed is at its highest from stoichiometric through into moderately rich territory, depending on the fuel, and the curve either side of that isn't symmetrical. Going richer than the peak, flame speed tails off gently. Leaning out, it drops away far more steeply. Flame speed influences how quickly the kernel grows in those first few crank degrees after the plug has fired. A kernel that grows quickly is less influenced by the local conditions at the plug, purely because it spends less time subjected to them. A kernel that grows slowly is subject to the local conditions for longer, and this means an increase in combustion variability.
So the pattern follows the flame speed curve. Cyclic variation is lowest between stoichiometric and slightly rich, where flame speed is highest. Lean the mixture out and variation increases. Slightly at first, then sharply once the mixture is properly lean, where the flame kernel takes much longer to establish and the early stages of the burn become far less repeatable. Going richer than the flame speed peak doesn't help either, so more fuel is not automatically more stable. Usually some testing across a range of mixtures is needed here to determine what's going to work best, and of course consideration of the broader effects of an overly rich mixture is always necessary.
There are two separate mechanisms at work here. Mixture affects the knock threshold directly, through charge cooling and by speeding combustion up so the end gas spends less time at elevated temperature and pressure. What mixture does to cyclic variation is separate. A faster flame doesn't just move where the average cycle lands, it pulls the spread in around it, and it's the fast tail of that spread that sets the limit.
On the face of it a faster burn can't both help and hurt, so it's worth reviewing the two scenarios. A combustion system that burns faster by design reaches MBT using less advance and, with timing set to suit, the end gas is consumed sooner and the knock limit improves. Inside a single run of cycles ignition timing doesn't change, so a cycle that burns faster than the one we set the timing for is simply over advanced, and that's the cycle that knocks. Faster combustion helps when we retime around it, and costs us when it happens on its own.
Mixture is only one lever, but there are a couple of other factors that can influence kernel development as well. Charge motion, meaning the tumble and swirl in the cylinder, stirs the mixture and speeds up the early burn. Ignition energy and spark duration are also factors, and how well mixed (or homogeneous) the charge is by the time it reaches the plug. Residual exhaust gas, from any active EGR or valve overlap, can also influence combustion variability, so there's a bit going on.
The main takeaway here is that every one of these factors works through the same mechanism, which is how robust and repeatable the early kernel is. When the spread comes down, the early burn has become more consistent, and that consistency is what gives us room to move on timing or boost etc.
Deciding how much additional timing an observed spread will let you run is another topic entirely. What matters here is the why, and to understand a bit more about what is going on in the cylinder. The spread in the pressure trace is what influences your knock limit (for the same fuel), and improving combustion stability goes some way towards improving that limit.
What it doesn't tell you
For everything it shows us, a pressure trace has some limitations.
It shows you what happened, not why. A trace can tell you a cylinder is down on peak pressure, or that combustion is late, or that one cylinder is more variable than the rest, but it won't tell you whether the cause is fuelling, ignition, airflow, or something else mechanical like a sticky valve. It sharpens the question and points you at the right cylinder, but the diagnosis is still yours to do.
It's also specialist equipment. Getting a sensor into the chamber is invasive. The sensors can be expensive compared to what we're typically used to for general tuning, and they have a finite life under combustion conditions. That's why this work mostly lives in engine development and serious motorsport rather than everyday tuning. None of that makes it academic though. What you see on the trace is the mental model sitting behind every indirect measurement you already use, and this level of equipment is becoming more and more accessible all the time.
It also doesn't replace anything. Lambda, EGT, knock sensors, and the dyno all still matter. What a pressure trace adds is a direct view of the one event those measurements describe from the outside and, used alongside them, it tells us what they were pointing at all along.
That direct view is extremely valuable. Once you've seen the pressure event itself, and know what phasing, peak pressure, and cycle to cycle stability look like on a trace, you read every indirect measurement a little differently, because you know what it's trying to represent. Where in-cylinder pressure measurement really shines is in knock detection, particularly for noisy engines, where separating mechanical vibrations from knock vibrations becomes all but impossible.
Key points
So, let's bring this all together.
- No two combustion cycles are identical. Run at a steady operating point, peak pressure and its location both vary from cycle to cycle, driven mostly by variation in the early flame kernel development at the spark plug.
- The spread shows up two ways, in where the peak occurs and in how high it gets. The first is measured as a standard deviation in crank degrees, the second as a coefficient of variation. CoV of Pmax and CoV of IMEP are the conventional stability numbers, and they aren't interchangeable with each other or with the crank angle spread. They mean different things.
- Timing is set for the average cycle, so the fastest burning cycles peak both earlier and higher and reach the knock threshold first. KLSA is really limited by the worst cycles in the spread, not the average one. The Pmax ceiling works the same way, since it has to be set against the highest cycles rather than the average.
- Reducing cycle to cycle variation tightens the distribution and lets you run more timing before the fast cycles knock.
- Mixture is one lever, and it works through flame speed rather than acting on stability directly. Flame speed is highest from stoichiometric through into moderately rich territory, so variation is lowest there and rises as the mixture leans out. Enriching past that peak buys us nothing in terms of variability and will eventually worsen the situation.
- Charge motion, ignition energy, mixture homogeneity, and residual fraction are the other levers, and all of them act through the same early flame kernel development.
- A pressure trace shows what happened, not why. It's specialist equipment and it doesn't replace the measurements we already use. It completes them by giving a direct view of the event they all otherwise describe indirectly.
As always, once we understand what's happening from one cycle to the next, the limits we run into stop being arbitrary, and we're in a much better position to work with them.
If there's a specific topic or area you'd like us to cover in a future article or video, we'd love to hear from you. Send your requests through to support@efimastery.com and we'll keep you posted.
The pressure data behind this series was captured with the PLEX PCA-2000 combustion analysis system. Thanks to PLEX for supplying data and reviewing both articles.
Related Resources
Related Articles
Knock, combustion phasing, and lambda targeting are covered in depth in Stage 3 of the Calibration Competence and EFI Master Programs. Take the free assessment to find out which one fits your goals.
Find Your ProgramGet notified of new articles
One article per week on EFI fundamentals, calibration principles, and diagnostic thinking. No spam.
You're subscribed. We'll let you know when new articles are published.