Volumetric efficiency itself, what it is and how it's calculated, is the easy part. What the shape of your VE table tells you about how the engine breathes, and what it means when that shape isn't right, is where it gets useful.
That's the focus of this article. We're not going to re-derive the VE formula or walk through a speed-density tutorial. If you want to understand how VE is calculated then our 4-Stroke Engine Essentials course covers VE from the ground up. It's free and part of Stage 0, which is the common entry point to all of our Programs. Here, we're looking at the VE table as a diagnostic tool.
Quick refresher
Volumetric efficiency is the ratio of the actual air mass entering the cylinder to the theoretical maximum for that cylinder's displaced volume, at a given ambient density. It tells us how effectively the engine fills its cylinders during the intake stroke.
In a speed-density system, the ECU uses a VE table indexed by engine speed and load (typically manifold pressure) to model this airflow. The VE value, combined with manifold pressure and intake air temperature, lets the ECU calculate air mass and work out fuel delivery.
VE is not constant. It changes with engine speed, load, and a range of design factors. This is what gives the VE table its characteristic shape.
It's also worth keeping in mind that VE is directly linked to torque production. The more air the engine can take in, the more fuel it can burn, and the more torque it can produce. At wide open throttle, the shape of your VE curve across RPM closely mirrors the shape of your engine's torque curve. This is one of the reasons the VE table shape matters beyond just getting your fuelling right.
At wide open throttle, the shape of your VE curve across RPM closely mirrors the shape of your engine's torque curve.
What a healthy VE table looks like
Before you can spot anomalies, you need to know what normal looks like for a naturally aspirated engine.
The load axis
Along the load axis, VE increases as the throttle opens. At part throttle, the throttle plate restricts airflow into the engine, reducing the pressure available to fill the cylinder. As the throttle opens, this restriction reduces and the cylinder fills more effectively.
At wide open throttle, the throttle is no longer the main restriction. VE is now governed by other parts of the intake and exhaust system, which we'll cover shortly.
The result is that VE values are lowest at light loads and progressively increase as manifold pressure rises towards atmospheric.
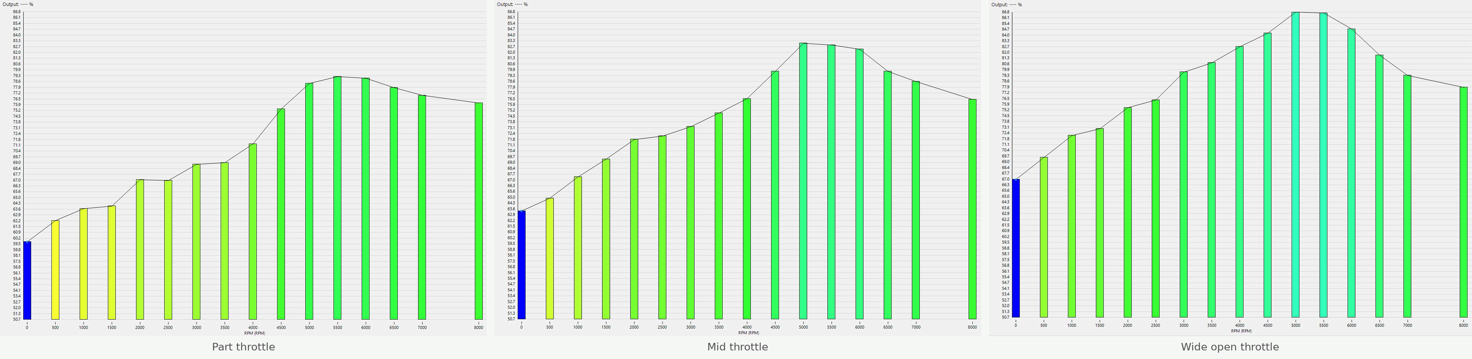
The RPM axis
This is where things get more interesting. For a typical naturally aspirated engine, VE rises with engine speed from idle, peaks somewhere in the mid-range, and then drops off at higher RPM.
This hump shape exists because of two competing effects. At low to moderate engine speeds, the rising air velocity in the intake helps fill the cylinder. The air column builds momentum, and this inertia helps push charge into the cylinder even as the piston slows near the bottom of the intake stroke.
At higher engine speeds, the flow restrictions in the intake system, primarily the ports, valves, and valve lift, start to limit how much air can get through. The engine wants more air than the intake can deliver, and VE starts to fall.
Where VE peaks on the RPM axis is directly tied to the engine's breathing hardware. Remember this, because it's the key to using the table diagnostically.
Where VE peaks on the RPM axis is directly tied to the engine's breathing hardware. This is the key to using the table diagnostically.
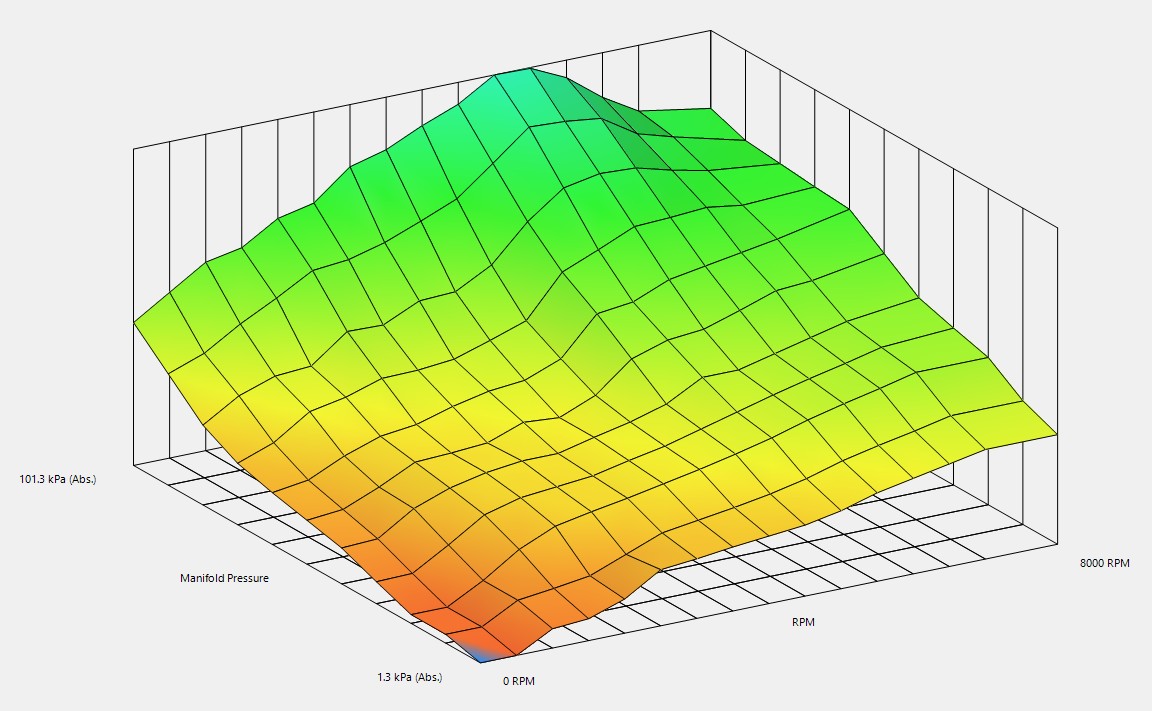
The overall picture
If you look at the VE table from above, you'll see values climbing from the low-load, low-RPM corner towards the high-load region, with a ridge of peak values in the mid-to-upper RPM range at wide open throttle. The surface should be smooth and continuous. A healthy VE table looks like gentle terrain, not a mountain range.
What shapes the table
Understanding the factors that move the VE peak around is what turns the table into a diagnostic tool.
Camshaft
The cam has a major influence on where VE peaks in the RPM range. A mild cam with short duration and low lift will peak at lower RPM, because the valve isn't open long enough to flow sufficient air at high speed. A more aggressive cam shifts the peak higher, but at the cost of lower VE at the bottom end.
This is a fundamental trade-off. A cam that fills well at 8000 RPM will compromise filling at 3000 RPM, and vice versa. This is why variable valve timing exists. By adjusting cam phasing with engine speed, manufacturers can keep VE high across a broader range.
If the VE peak is in a different RPM range than you'd expect, the cam is the first thing to consider. An aftermarket cam with more duration than stock will shift the peak up the rev range and show lower VE at the bottom end.
Intake runner length
When the intake valve closes, it creates a pressure wave that travels back up the intake runner, reflects off the plenum, and returns. If the runner length is right, this reflected wave arrives back at the valve just as it opens for the next intake event, helping push extra charge into the cylinder. This is called ram tuning.
Longer runners produce this effect at lower RPM, shorter runners at higher RPM. In the VE table, you'll see it as a localised hump at the RPM where the resonance is effective. Engines with variable-length intake manifolds may show a flatter curve or multiple smaller peaks, because the system adjusts runner length across different speeds.
Port and valve sizing
The physical size of the intake port, valve diameter, and valve lift set an upper limit on airflow. A larger port and valve supports more peak airflow, but can reduce air velocity at lower RPM. This is the small-port-versus-big-port trade-off.
In the VE table, large ports tend to show a steeper fall-off at low RPM, while smaller ports hold up better at the bottom end but run out of flow capacity sooner at the top. The valve curtain area is often the most restrictive point in the entire intake tract, and it's the main reason VE drops at high RPM regardless of what else you do.
Exhaust system
A well-designed exhaust uses pressure waves to help scavenge exhaust gas from the cylinder during valve overlap, making room for fresh charge. This shows up as a broad improvement in VE across a particular RPM band. A restrictive exhaust raises backpressure and suppresses VE, especially at higher RPM where exhaust mass flow is highest.
Forced induction
On a turbocharged or supercharged engine, VE exceeds 100% once the engine is in boost, because the intake system is pressurised above atmospheric.
Turbo engines typically show VE below 100% at low RPM before the turbo spools, climbing rapidly as boost builds. Supercharged engines tend to show a more linear rise. If you see unexpected dips or flat spots under boost, it may point to the compressor operating in an inefficient part of its map, or elevated charge temperatures reducing air density before it reaches the cylinder.
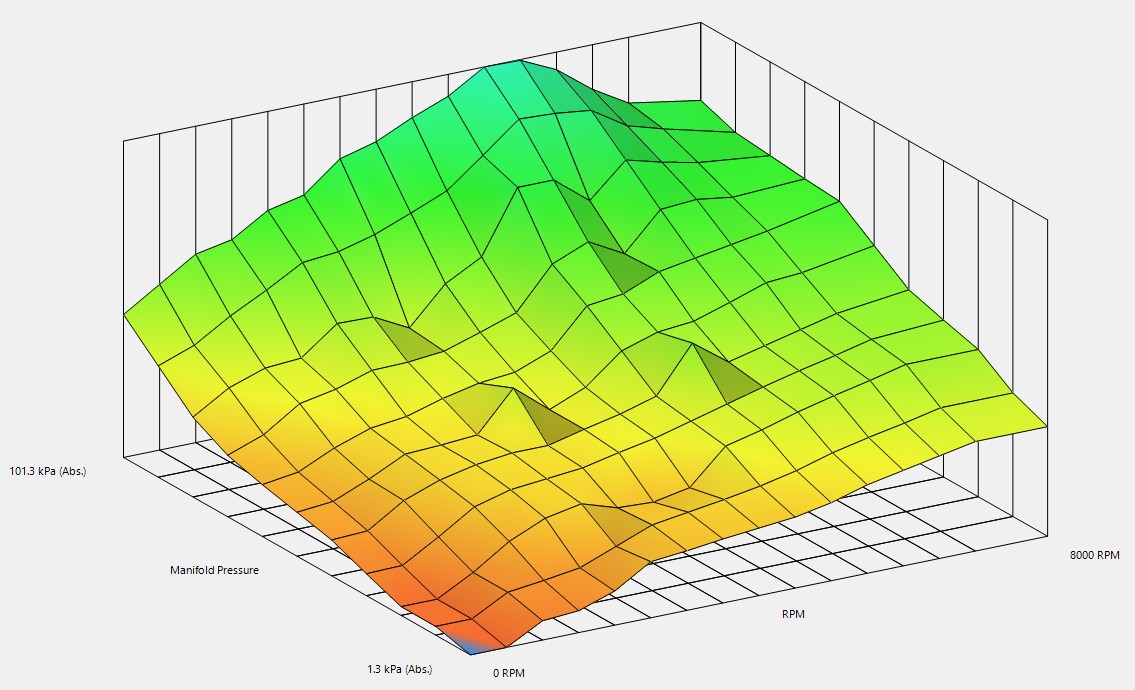
Reading deviations: what the anomalies tell you
This is where the VE table earns its keep as a diagnostic tool. When the shape doesn't match what you'd expect for the engine, it's pointing you somewhere specific.
When the shape doesn't match what you'd expect for the engine, it's pointing you somewhere specific.
Low-RPM dips
If VE drops at low RPM, especially at higher loads, the most common cause is excessive valve overlap from a large cam. At low RPM, exhaust gas velocity is too low to create a scavenging effect during overlap. Instead, exhaust flows back into the intake (reversion), diluting the incoming charge.
In the VE table, this shows as a dip at low RPM that recovers as speed increases. On an engine with a big aftermarket cam, this is expected behaviour. If you see it with a stock cam, something else is going on.
Mid-range humps and dips
Localised humps in the mid-range usually correspond to intake resonance effects. A pronounced hump followed by a dip may indicate the RPM at which the reflected pressure wave switches from helping to hurting cylinder filling.
On engines with variable-length intake manifolds, a step or discontinuity at a particular RPM may be the point where the manifold switches runner length. This is normal.
Steep high-RPM fall-off
A steep drop in VE at high RPM tells you the intake system is hitting its flow limit. The steeper the drop, the more restrictive the system.
If the fall-off is steeper than you'd expect, look at the entire intake path. An undersized air filter, restrictive intake piping, or a small throttle body can all cause premature VE decline. The table doesn't tell you which component is the bottleneck, but it tells you one exists and roughly where in the rev range it becomes dominant.
Flat spots
A plateau where VE should still be climbing suggests a restriction that limits airflow across a range of speeds rather than at a single point. This is common with undersized throttle bodies or intake piping that creates a bottleneck at moderate to high flow rates.
Cylinder-to-cylinder inconsistencies
If you have per-cylinder data, either through individual lambda correction or cylinder pressure analysis, differences between cylinders point to uneven distribution. Intake runner length differences, unequal port flow, or sealing issues can all cause this.
Most tuners won't have per-cylinder VE data directly, but if lambda correction values consistently favour certain cylinders in closed-loop, that's the VE imbalance showing up indirectly.
Key points
The VE table is more than a fuelling map. When you understand what shapes it, the table becomes a window into your engine's breathing.
- Where does VE peak on the RPM axis? This tells you where the intake system and valve events are best matched. If it doesn't line up with the cam and intake design, something is limiting or enhancing flow outside the expected range.
- How steep is the high-RPM fall-off? This reveals how restrictive the intake path is.
- Are there humps or dips in the mid-range? These often trace back to intake resonance effects.
- Is the low-RPM behaviour consistent with the cam? Big cams will show low-RPM VE reduction. If you see it on a stock cam, dig deeper.
- Is the surface smooth? Steps, spikes, or discontinuities that don't match a known hardware change are worth investigating.
The VE table is a fingerprint of your engine. Every component in the airpath leaves its mark. Learning to read that fingerprint is one of the most valuable diagnostic skills you can develop.
Related Resources
Reading the VE table as a diagnostic tool, and the calibration workflow behind it, are covered in Stage 5 of the Calibration Competence and EFI Master Programs. If you're not sure which one fits your goals, do the free assessment and it'll point you in the right direction.
Find Your ProgramGet notified of new articles
One article per week on EFI fundamentals, calibration principles, and diagnostic thinking. No spam.
You're subscribed. We'll let you know when new articles are published.