What a cam profile actually controls
To understand how cam specs map to VE table shape, it helps to think about what the camshaft is actually doing in the engine cycle.
The intake stroke works because there's a pressure difference between the atmosphere outside the engine and the relatively low pressure inside the cylinder as the piston travels down the bore. That pressure difference drives air in through the open intake valve. The more effectively we can use that intake stroke to fill the cylinder, the higher our volumetric efficiency at that operating point.
The camshaft controls three things that directly govern how well that filling happens. These are timing, lift, and duration and they define when the intake valve opens relative to the piston/crankshaft position, how far it opens, and how long it stays open. Lift and duration are set by the shape of the cam lobe. In the case of variable cam timing, the valve timing can be adjusted relative to crankshaft position to some degree, otherwise the lobe position on the camshaft sets up the valve timing directly.
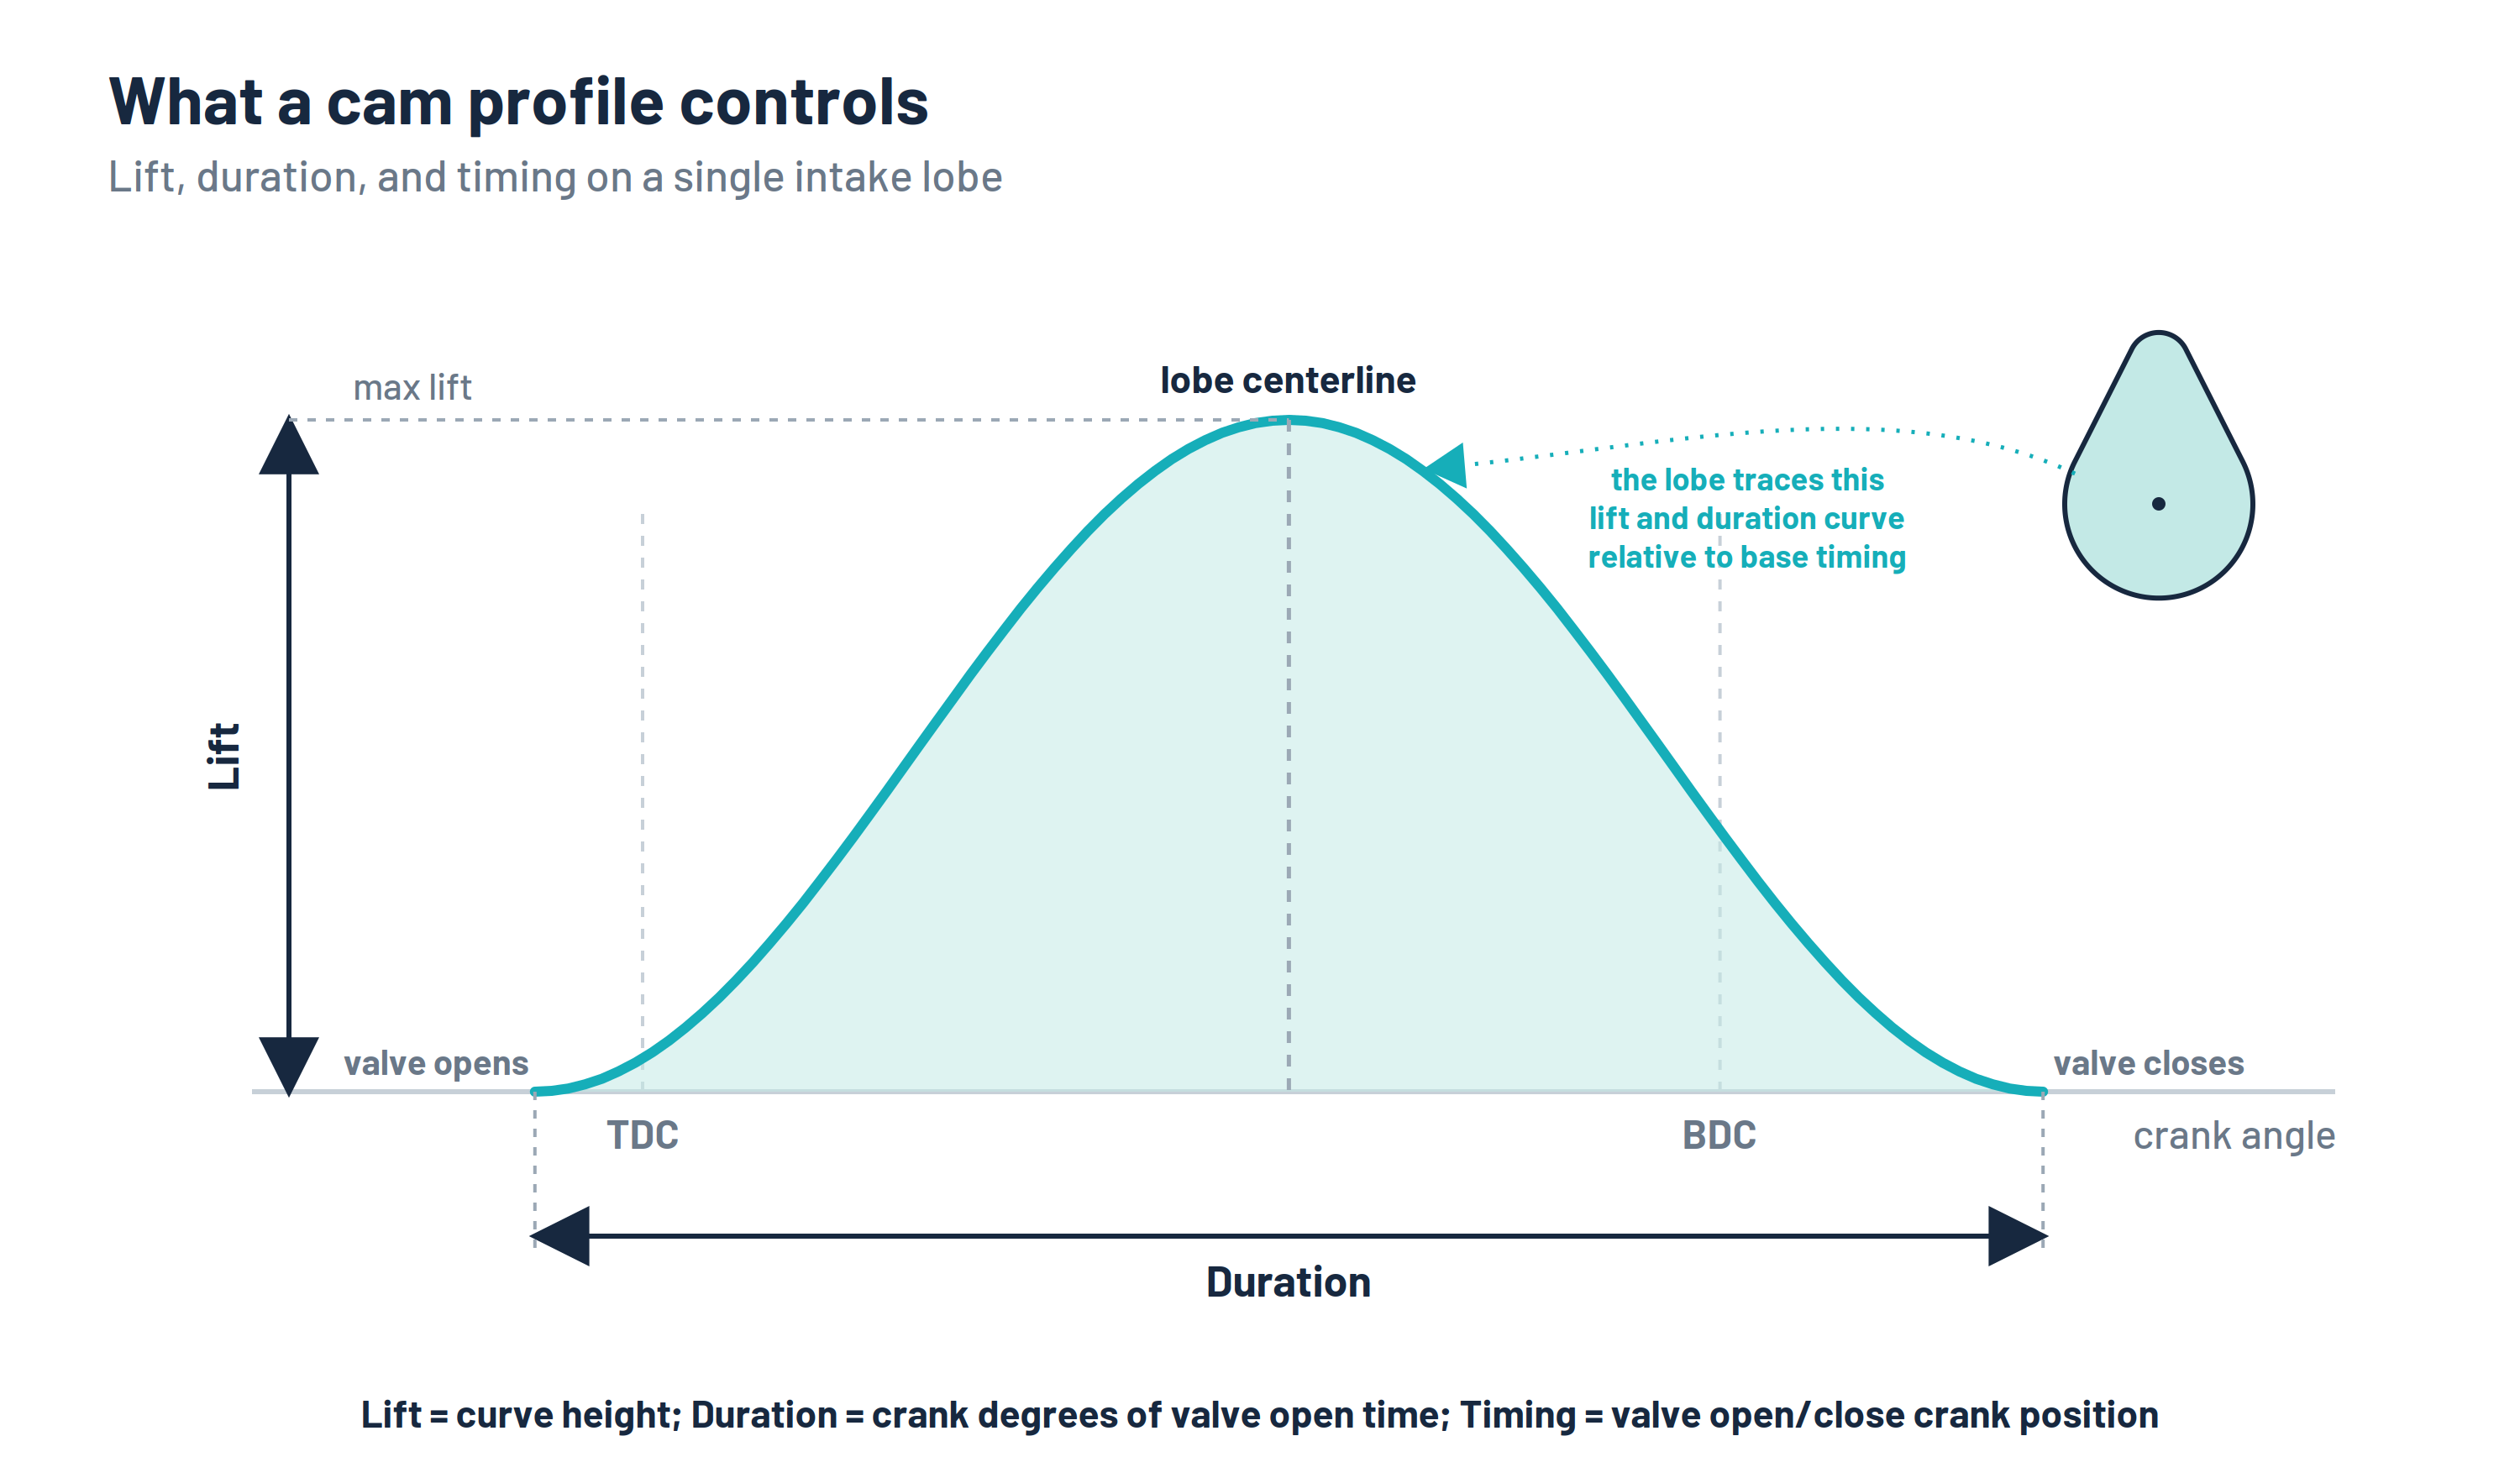
If you change the lobe profile you can affect one, two, or all three of these parameters. Which means you change when, how much, and for how long air can move into the cylinder at any given engine speed. That is what the VE table captures. It's a map of how effectively the engine fills its cylinders across the RPM and load range, making the camshaft timing and profile a key contributor to its shape.
Duration: which RPM range for efficient cylinder filling
Duration is the number of crankshaft degrees that the valve is held open, and it's the most significant cam parameter for shaping where VE peaks on the RPM axis.
At low engine speeds, the piston is moving relatively slowly. There's plenty of time for air to enter the cylinder through a moderately open valve, even if the valve doesn't stay open for long. The short duration profile opens and closes the valve in a relatively tight window, which keeps the intake charge from flowing back out as the piston slows near Bottom Dead Centre (BDC), and we find that the engine fills efficiently in the low-to-mid RPM range.
At high engine speeds, the conditions have changed dramatically. The piston is moving quickly, the entire intake event happens in a much shorter time window, and the air entering the cylinder has significant momentum owing to the increased air velocity. A long-duration cam keeps the intake valve open well past BDC, long enough for that momentum to continue pushing charge into the cylinder, even as the piston starts back up on the compression stroke. This is what supports high-RPM filling.
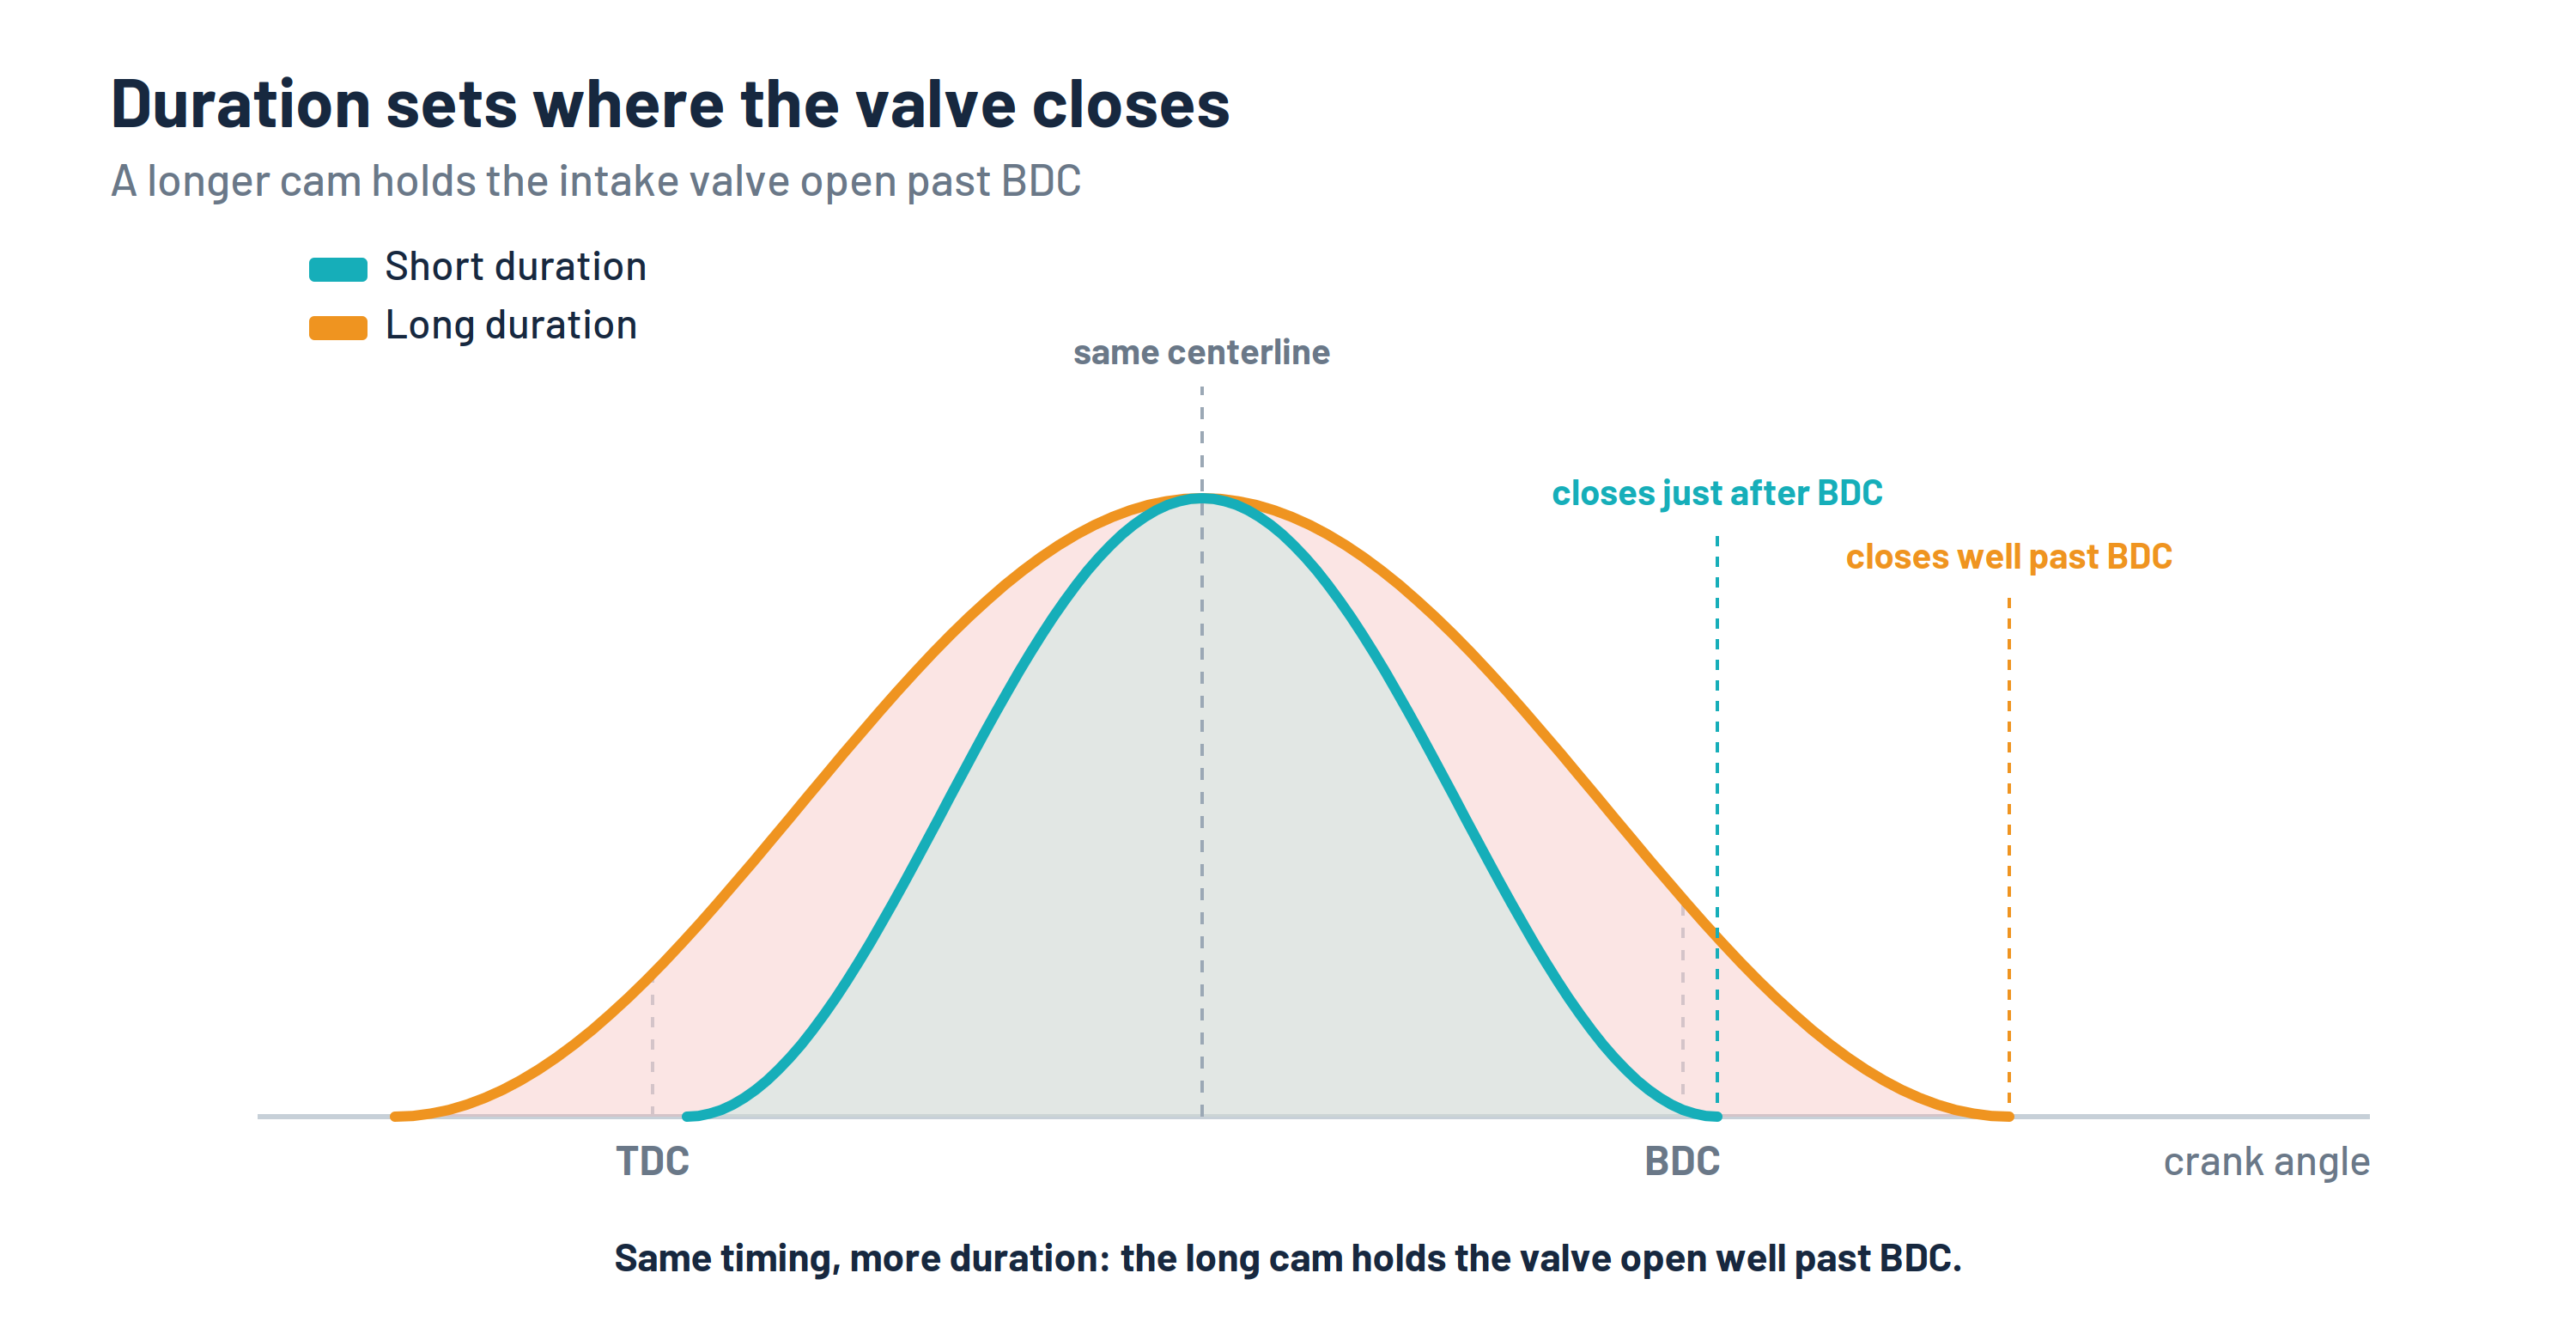
The trade-off becomes pretty obvious. A cam that's optimised for high-RPM filling will keep the valve open too long at low RPM, allowing charge that's already entered the cylinder to be pushed back out as the piston rises. Ultimately, in this scenario, low RPM VE suffers.
Duration determines which RPM band the engine fills best. Increased duration shifts that band up the rev range and takes something away from the bottom end in exchange.
In the VE table, this shows up clearly. A mild, short-duration cam produces a table with good VE across the low-to-mid RPM range and a peak that sits relatively early. A long-duration performance cam produces a table where the peak is shifted higher up the rev range, and the low-RPM cells are notably lower than they'd be on the milder cam. The VE table shape changes, and the peak moves up. Compared to a stock cam, the differences can be significant enough that the two VE tables would look like they came from completely different engines, even if everything else is identical.
Lift: moving more air
Lift is the maximum distance the valve travels from its seat, and it sets an upper limit on how much air can flow through the valve opening at any point during the intake event.
The valve curtain area, which is the area formed by the gap between the valve head and seat as the valve lifts, is the narrowest point in the entire intake path for much of the lift curve. Flow through this gap grows as the valve lifts, but the gains shrink as lift increases. On paper, once valve lift reaches roughly a quarter of the valve diameter, the curtain area has grown to match the area of the port behind the valve, so you'd expect the port to take over as the restriction from that point. Real airflow doesn't quite behave that way though. The air can't make use of the full curtain area because of flow losses as it squeezes past the valve and seat (the discharge coefficient describes this, discounting the theoretical area down to what the air actually uses). The practical result is that extra lift continues to improve flow beyond the area-based crossover point, and so valves are commonly lifted to around 0.35 to 0.4 of the valve diameter before the port area becomes a genuine restriction.
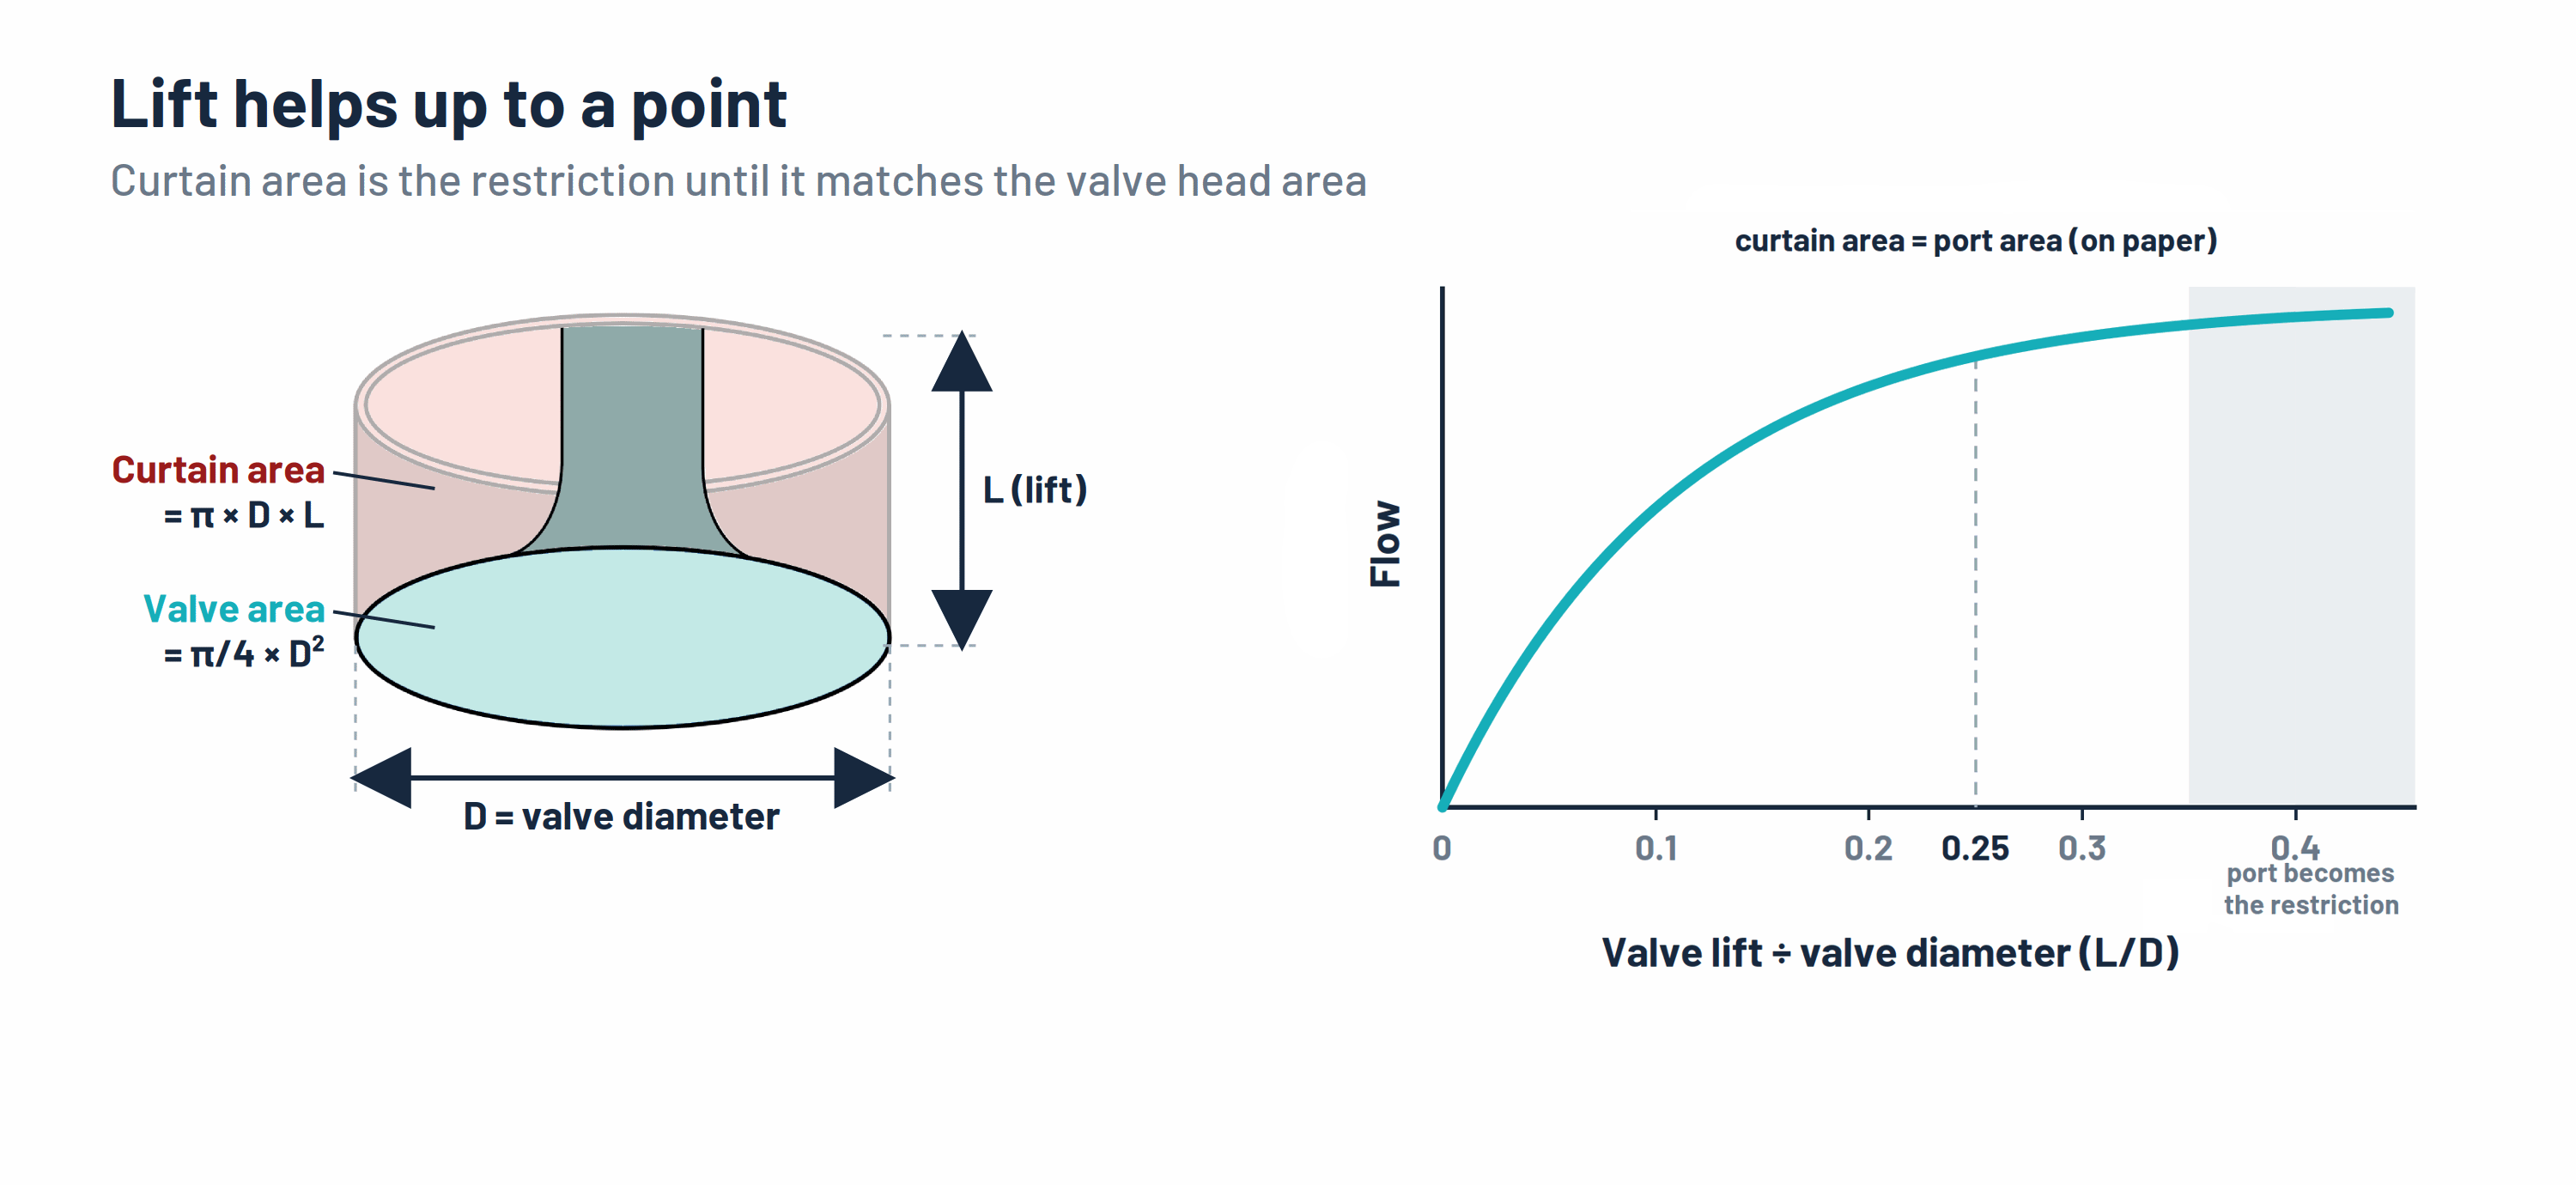
While the valve curtain area is the narrowest point in the path, that doesn't make it a flow limitation at every engine speed. At low RPM, where flow rate demands are also low, the cylinder doesn't require as much airflow and so air moves through the valve relatively unrestricted. There's almost no pressure drop across the valve, the cylinder fills almost completely in the time available, and the curtain area is more than the engine needs. Extra lift at low RPM just adds unnecessary curtain area, and VE barely changes.
At high RPM and higher flow rate demands the benefits of higher valve lift will come into their own. The piston moves fast, the cylinder needs a lot of air in very little time, and air has to rush through the valve. Pressure drop climbs as velocity through the valve increases, the cylinder can't fill completely, and VE starts to fall. This is what more lift is for. The extra area lets the same air through with less pressure drop by reducing the velocity, propping up VE further up the rev range, where a lower-lift cam has already run out of flow.
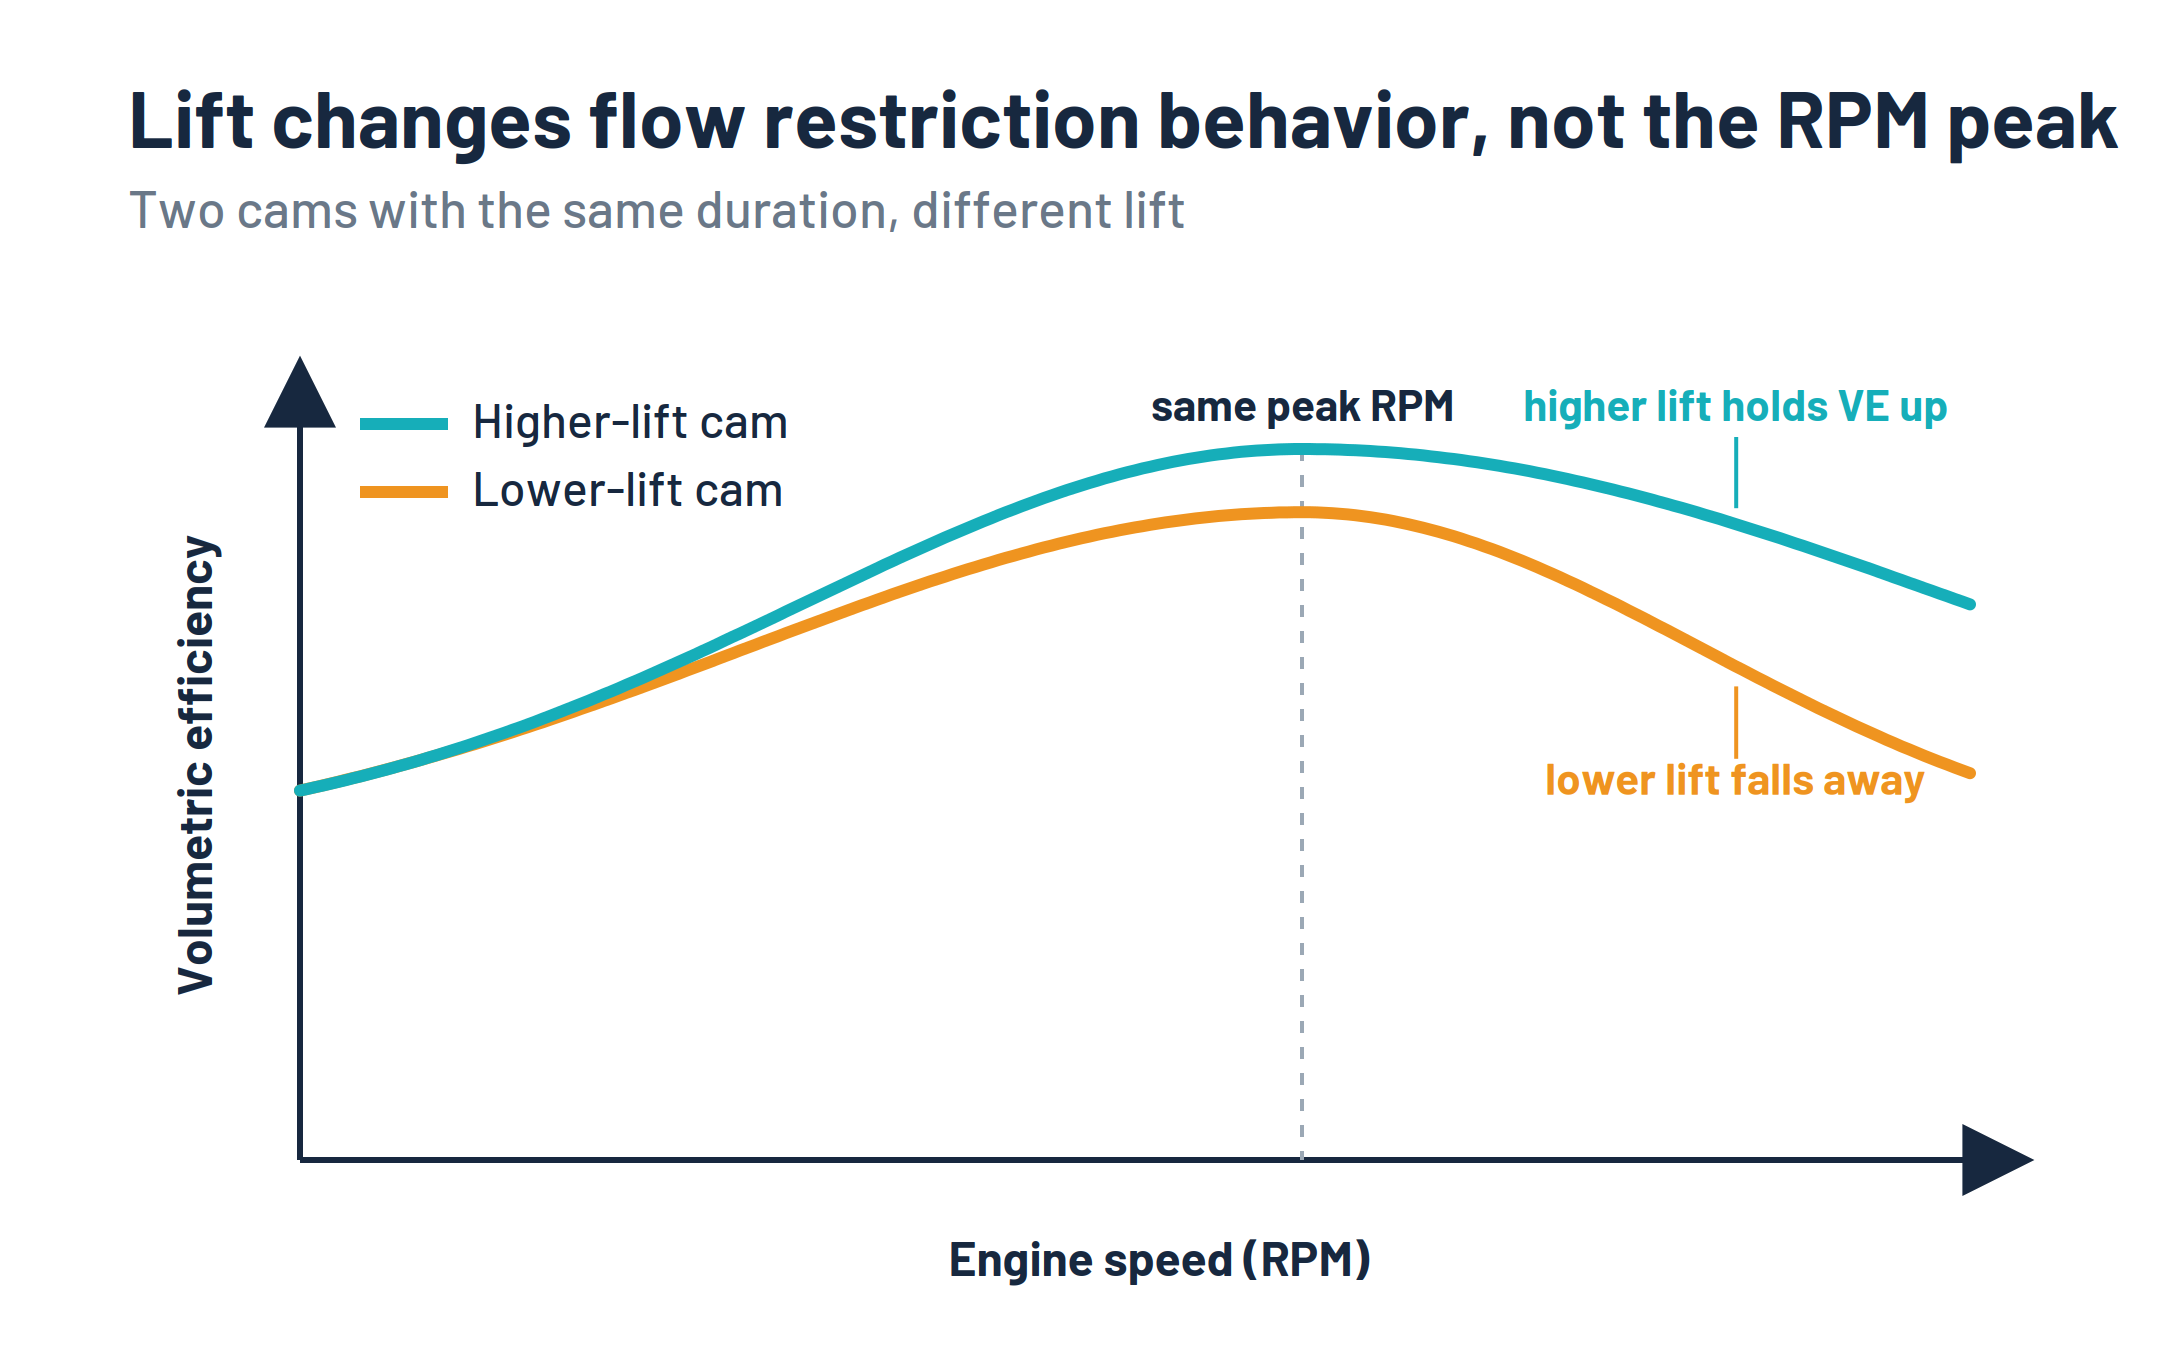
So, lift doesn't move the RPM peak the way duration does. Two cams with the same duration but different lift fill in much the same way through the low to mid-range, where the valve curtain area isn't the limit, and they peak at about the same RPM. The difference shows up at higher flow rates, where the higher-lift cam increases VE up top, while the lower-lift cam will have VE falling away more quickly as the valve becomes more and more restrictive to flow. More lift doesn't raise the whole curve, it extends the top of the curve, where the valve had become the restriction.
Lobe separation angle and overlap
Lobe separation angle, or LSA, is the angle in camshaft degrees between the centrelines of the intake and exhaust cam lobes. It's a fixed geometric property of the camshaft and locked into the camshaft design where the shaft has both intake and exhaust lobes.
A tighter LSA brings the intake and exhaust lobe centrelines closer together. A wider LSA pushes them further apart. What LSA influences is the overlap period, which is the window around TDC at the end of the exhaust stroke and the beginning of the intake stroke where both valves are open at the same time. Overlap is set by duration and LSA together. For a given duration, a tighter LSA produces more overlap, and at a given LSA, a longer-duration cam also produces more overlap. There are some exceptions to this depending on the symmetry of the lobe itself, but this generally holds true.
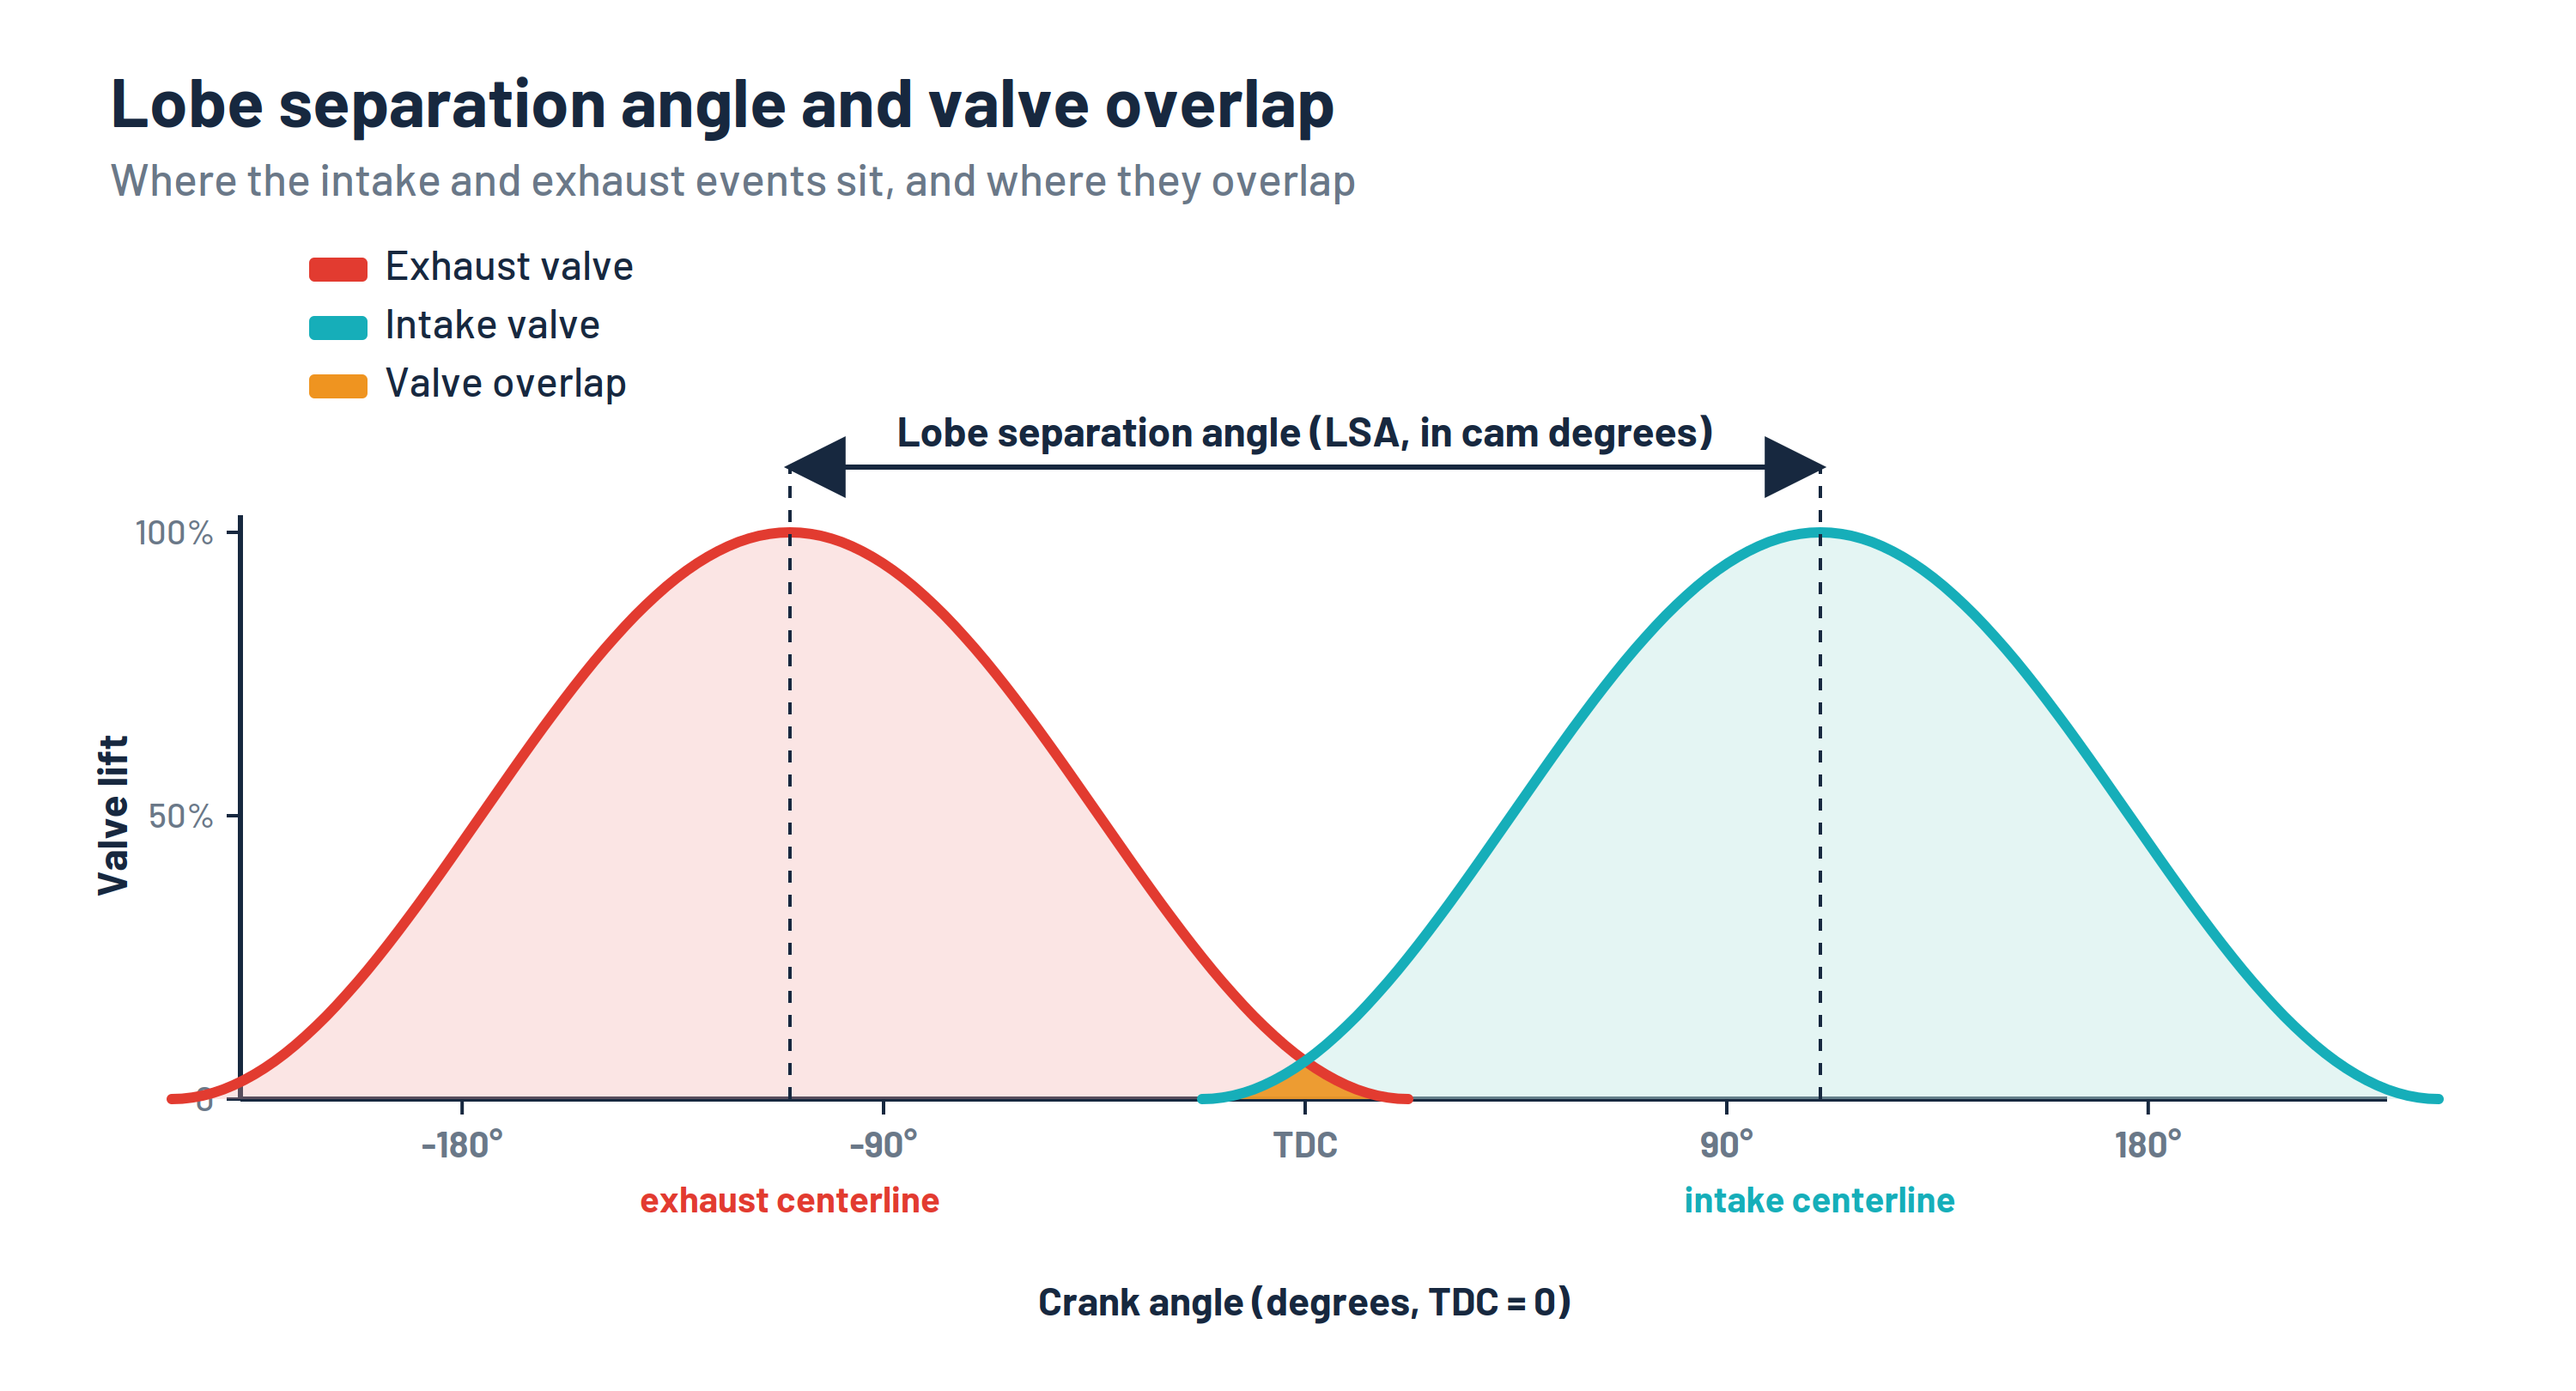
During overlap, exhaust gas is exiting through the exhaust valve while fresh intake charge is starting to enter through the intake valve. When this works well, the outgoing exhaust gas creates a low-pressure region behind it that helps pull fresh charge into the cylinder. At the right engine speed, it's a useful scavenging effect that can aid with cylinder filling, therefore further improving VE.
Overlap, set by duration and LSA together, is what gives a performance cam its characteristic idle and its high-RPM scavenging advantage.
A tight LSA (more overlap) amplifies this scavenging effect at high RPM. But at idle and low engine speeds, where exhaust gas velocity is low, the scavenging effect doesn't develop. Instead, the overlap period allows exhaust gas to flow back into the intake manifold, diluting the incoming charge with spent gases. VE at low RPM and at idle drops noticeably. This is why a cam with a small LSA idles roughly. The VE at idle is genuinely lower, and the mixture entering the cylinder is diluted and inconsistent cycle to cycle, and this is also why additional enrichment and a higher target idle speed is often needed for these types of high performance cams.
A wider LSA (less overlap) reduces this effect. It produces a smoother idle and better low-RPM cylinder filling, but gives up the top-end scavenging advantage.
On a DOHC engine with independent cam phasing (timing), the ground LSA of each cam is still fixed, but the relative phasing between the intake and exhaust cams can be adjusted during engine operation. That changes the effective overlap at the crank, which gives the calibrator a way to test and optimise effective LSA across the operating range, within the mechanical limits of the phasers, rather than committing to one fixed overlap value baked into the camshaft lobe design.
What this looks like in your VE table
Put duration, lift, and LSA together and they produce a VE curve with a predictable shape. The cam specs don't just tell you "this is a performance cam" in a general sense. They tell you where VE will peak, how aggressively it'll fall away below that peak, and what idle behaviour to expect.
A cam with moderate duration, reasonable lift, and a wide LSA produces a broad, relatively flat VE curve. It fills well across a wide RPM range and doesn't suffer too badly at either end. This is what most OEM performance engines use, because they need to be drivable across the whole range, not just at peak power.
A cam with long duration, high lift, and a tight LSA produces a narrow, tall VE peak that's shifted well up the rev range. The VE values below the peak fall away steeply, the idle cells are low, and the engine will be rough and unhappy below the RPM range the cam was designed for. This is what you'd expect on a purpose-built circuit engine where low-RPM driveability doesn't matter as much.
A bigger cam doesn't just raise the VE. It reshapes the entire curve, shifting the peak up the RPM range, dropping the bottom end, and often making idle and low-speed running considerably more difficult to manage.
On a forced induction engine, this is partially masked by the turbocharger or supercharger adding pressure above atmospheric once boost builds. The falling low-RPM VE values are less critical when boost pressure is compensating for them. But the shape is still there underneath, and it still influences how quickly the engine responds before the turbo spools.
If you want to understand VE table shape from the engine's perspective more broadly, what your VE table shape tells you about your engine covers how different hardware characteristics influence the finished table.
Why camshaft changes require recalibration
The key thing to understand is that the VE table is a map of one specific engine, with one specific camshaft, in one specific state of tune. It describes precisely how that combination of hardware fills its cylinders across the operating range.
Change the camshaft, and you've effectively changed the engine. The airflow characteristics are different at every RPM and load point. The old VE table isn't a rough approximation, it's a map of the wrong engine.
This matters even when the cam change looks modest. Even a mild performance grind, say something in the order of 10 to 15 degrees more duration and a little more lift, will shift the VE peak up the RPM range, reduce low-RPM values, and change the idle cell values. The ECU will be reading the actual airflow through the MAP sensor and IAT sensor and calculating fuel delivery based on VE table values that no longer reflect reality. The result is either a lean or rich condition across the operating range, depending on which direction the cam change moved VE at each operating point.
Any time the cam changes, the VE table no longer describes the airflow through that engine accurately. It needs to be recalibrated to capture changes in the airflow model to ensure fuelling remains on point.
There's a practical implication here as well. When you're starting a calibration on a freshly camshafted engine, the base map you start from matters less than you might think, because the shape of the finished table will be determined by the cam, not by whatever starting point you chose. What you're doing during calibration is mapping the engine's actual breathing behaviour. The cam has already decided what that looks like. Your job is to measure it accurately and build a table that reflects it. While a base map may give you a starting point, the cam profile should guide your mental prediction for VE shape.
If there's a specific topic or area you'd like us to cover in a future article or video, we'd like to hear about it. Send your requests through to support@efimastery.com and we'll add them to the list.
Key points
- The camshaft controls when the intake valve opens, how far it opens, and how long it stays open. These three parameters, timing, lift, and duration, directly govern how well the cylinder fills at any given engine speed. The VE table is a map of that filling behaviour.
- Duration is the strongest influence on where VE peaks in the RPM range. Longer duration shifts the peak up the rev range and reduces filling below it.
- Lift sets the curtain area at the valve. On paper this curtain area matches the port area at about a quarter of the valve diameter, but flow losses at the valve mean we will often see flow improvements to around 0.35 to 0.4 of the valve diameter before the port becomes the effective limit. More lift raises VE toward the top of the RPM range without significantly moving the peak RPM.
- Valve overlap is set by duration and lobe separation angle together. A tighter LSA increases overlap, which improves high-RPM scavenging but reduces VE at idle and low RPM, often producing a rough idle that needs a higher idle target and added enrichment to stay stable. On a DOHC engine with independent cam phasing, the effective overlap can be adjusted and optimised across the operating range.
- The cam specs predict the shape of the VE table before the engine is ever started. Duration tells you where the peak will sit, lift tells you how high it gets, and LSA tells you what the bottom of the table will look like.
- Any camshaft change requires VE table recalibration, because the old table no longer describes the engine's airflow accurately. You can still start from the old base map to get the engine running, then use the cam specs to predict where the table will diverge and address it ahead of tuning the high-load, high-RPM regions.
Cam profile theory connects with Stage 3, where the combustion process and how it interacts with valve timing is covered in depth, and into Stage 5, where VE table calibration is the core practical skill. Both stages are in the Calibration Competence and EFI Master Programs. Take the free assessment to find out which one fits your goals.
Find Your ProgramGet notified of new articles
One article per week on EFI fundamentals, calibration principles, and diagnostic thinking. No spam.
You're subscribed. We'll let you know when new articles are published.